
Image
|
Figure Caption
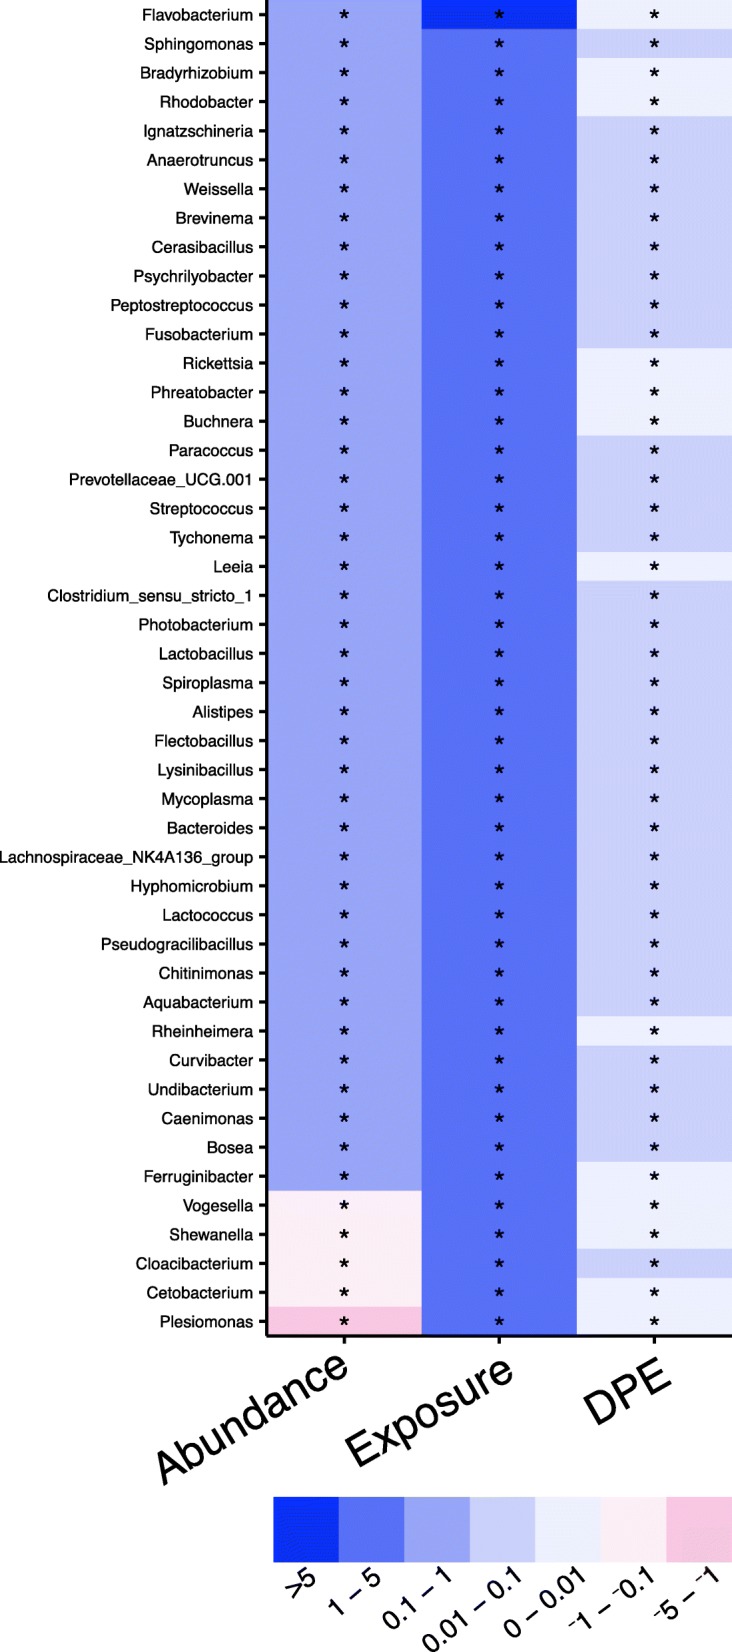
Fig. 5
Parasite burden is associated with microbial abundance. A heat map of coefficients from negative binomial generalized linear models with lowest AIC. The color of each cell represents the direction of the slope (red is negative, blue is positive). An asterisk in a cell indicates
Acknowledgments
This image is the copyrighted work of the attributed author or publisher, and
ZFIN has permission only to display this image to its users.
Additional permissions should be obtained from the applicable author or publisher of the image.
Full text @ Microbiome