
|
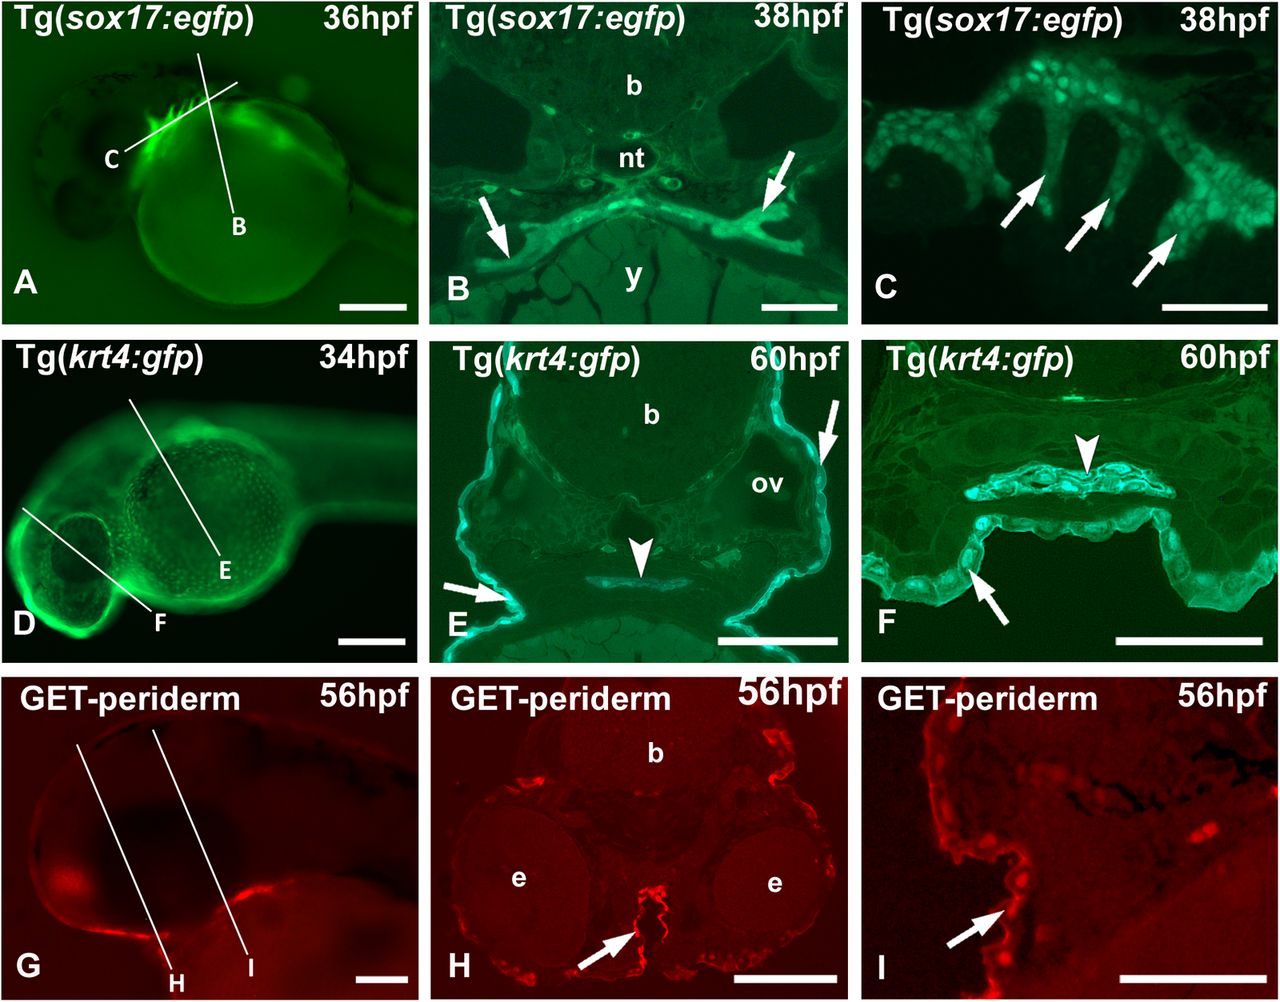
Fig. 1
Imaging of transgenic zebrafish lines. (A,D,G) Whole-mount, (B,E,H) low- and (C,F,I) high-magnification (B,E,F,H,I) cross sections and (C) sagittal section. Lines in A,D,G indicate approximate level of sectioning in B,E,H and C,F,I. (A–C) Tg(sox17:egfp) zebrafish with GFP-positive endodermal cells along the midline, extending into the pouches (arrows). Blood vessels also show a fluorescent signal. (D–F) Tg(krt4:gfp) zebrafish with GFP-positive periderm (arrows). Labeled cells also cover the oropharyngeal lining (arrowheads). (G–I) Et(Gal4-VP16)zc1044A;Tg(UAS-E1b:nsfB-mCherry)c264, abbreviated as GET-periderm line (GET, Gal4 enhancer trap) (Eisenhoffer et al., 2017). The periderm is labeled red (arrows). b, brain; e, eye; nt, notochord; ov, otic vesicle; y, yolk. Scale bars: (A,D) 250 µm; (E,G,H) 100 µm; (B,C,F,I) 50 µm.