
|
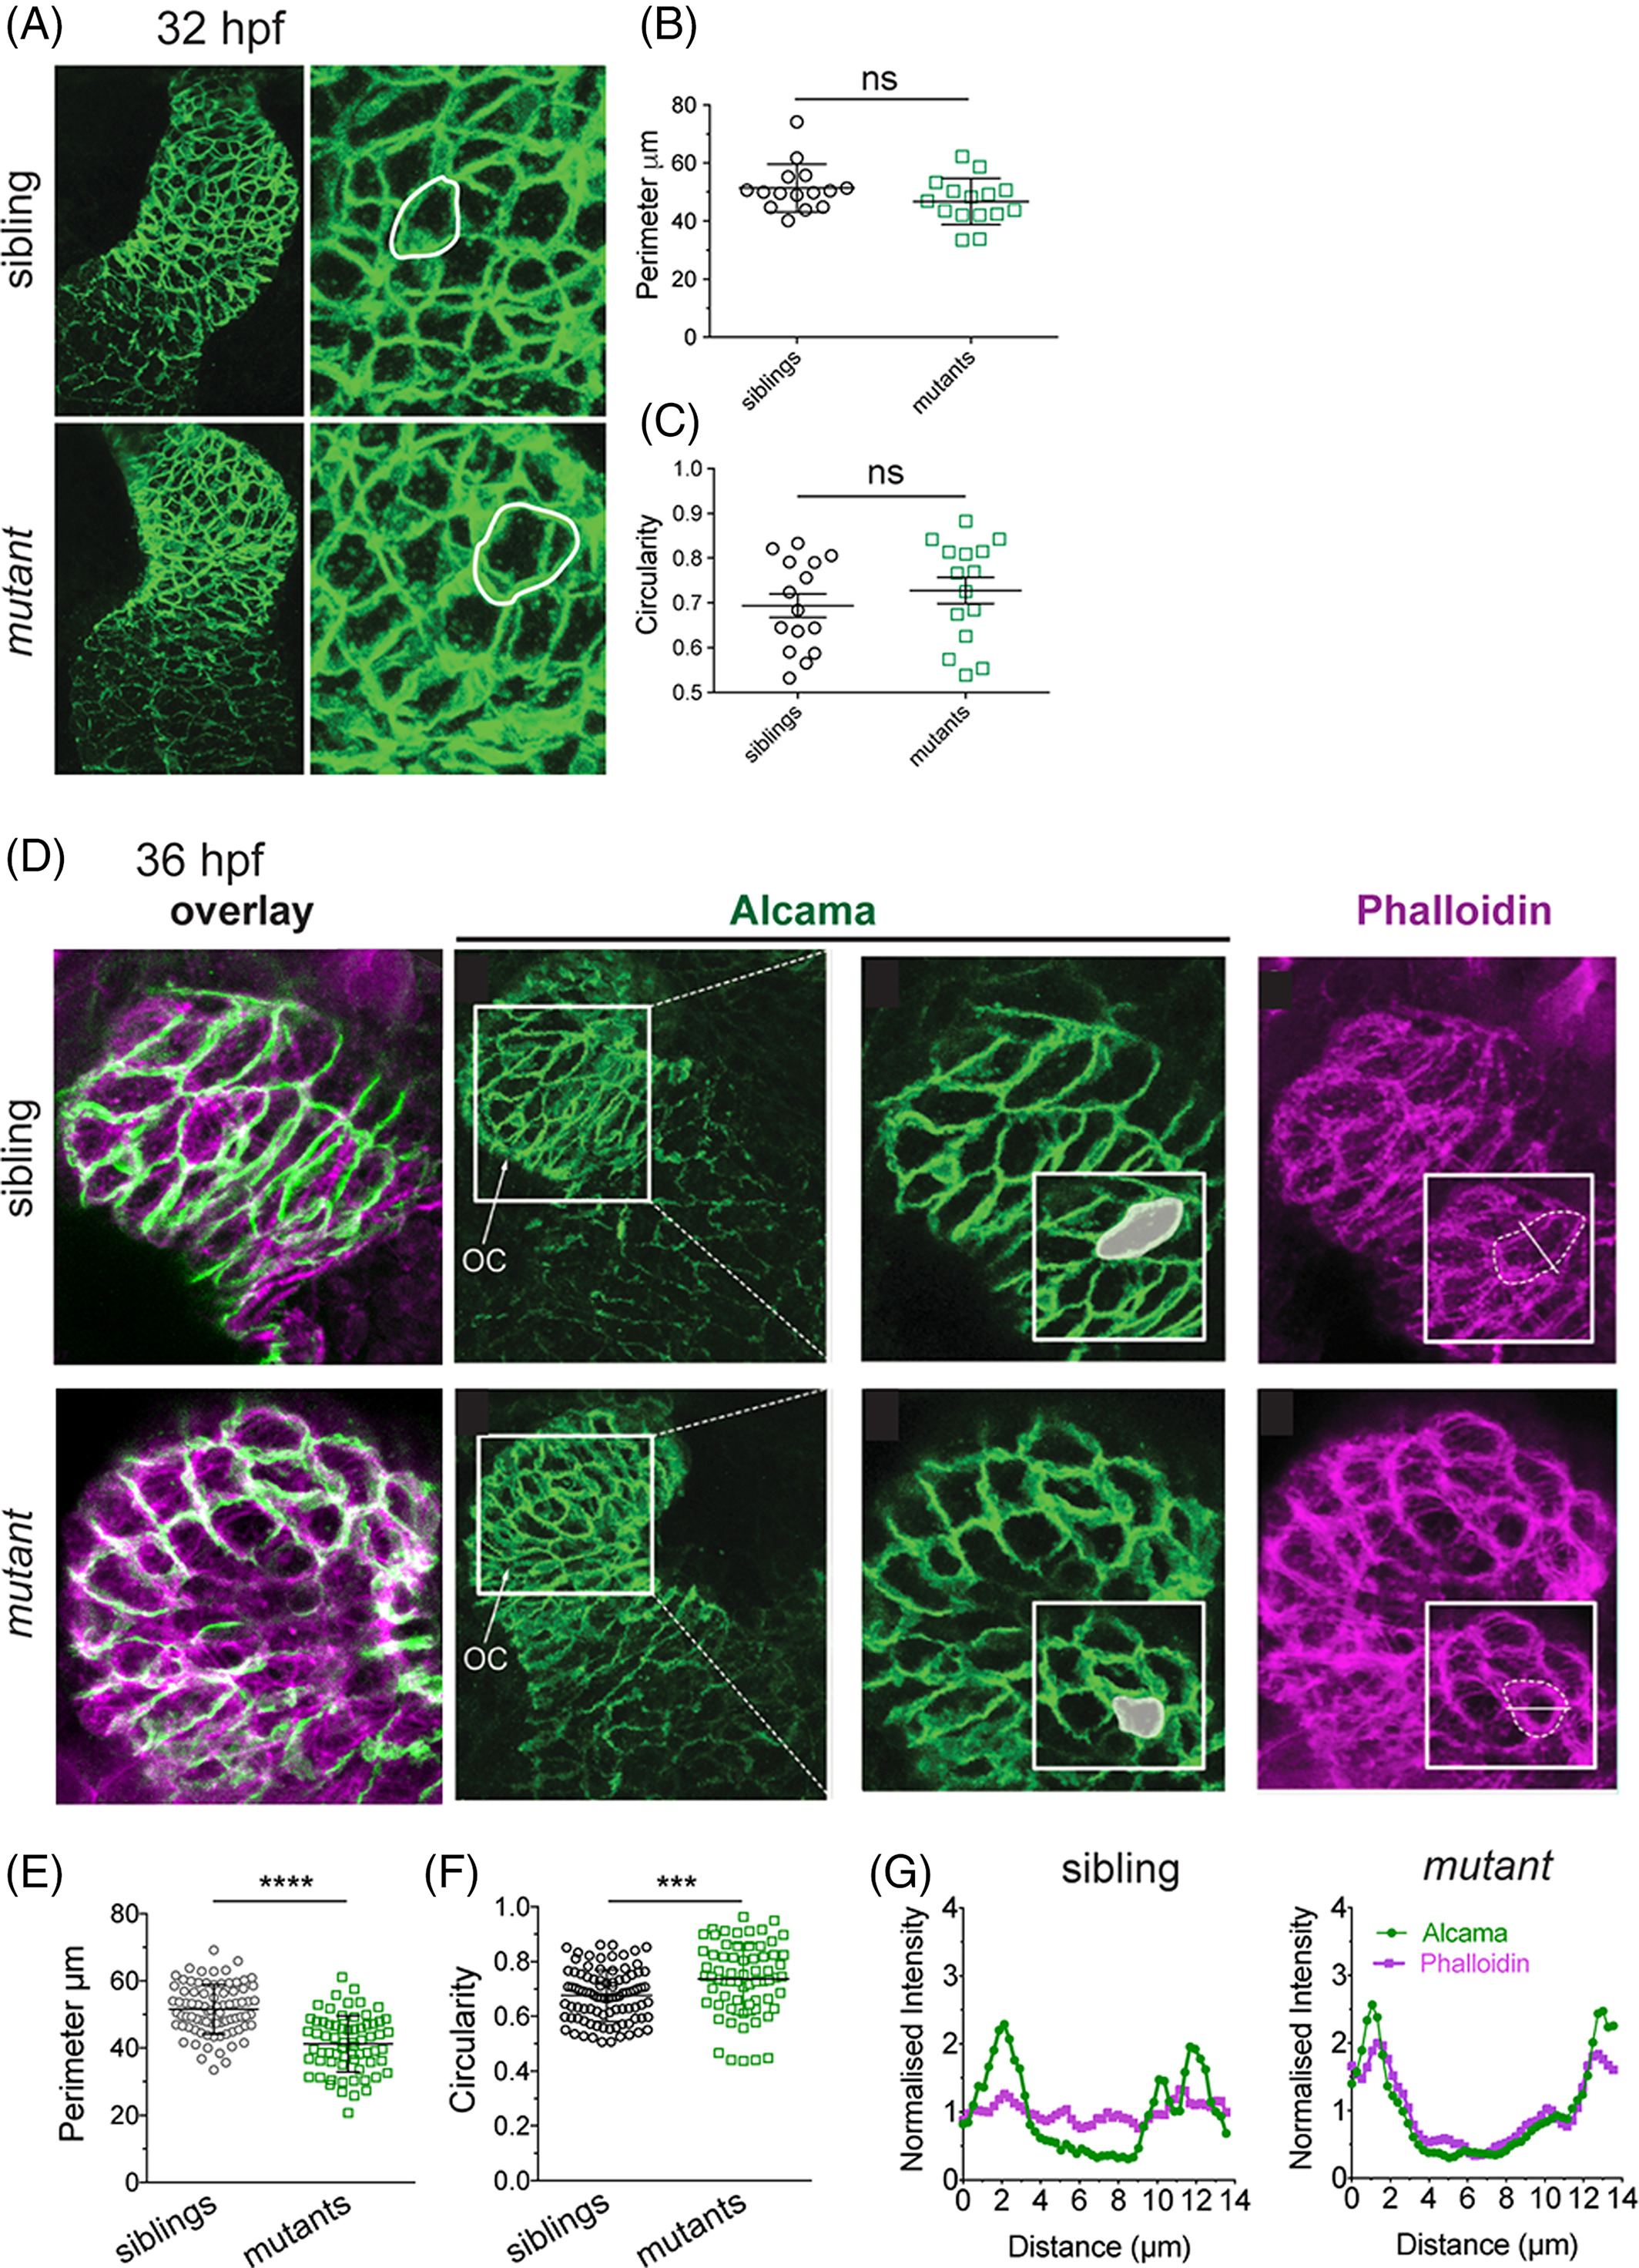
Fig. 7
The uq 23ks mutant phenotype is first evident at 36 hpf. A: Confocal imaging of Alcama staining on 32 hpf embryos shows both chamber morphology (zoom out) and cardiomyocyte perimeter and circularity (white outlines) indistinguishable between sibling and uq 23ksmutants at 32 hpf. B: Dot plots depicting measurements of perimeter and (C) circularity of cardiomyocytes showing no significant difference (ns) between siblings and mutants at 32 hpf. D: Confocal images of Alcama and F‐actin staining on 36 hpf embryos show cardiomyocytes are smaller and more circular in uq 23ks mutants compared with siblings at 36 hpf. Phalloidin staining shows F‐actin failing to traverse cells and remaining cortical in uq 23ks mutants compared with siblings. E,F: Dot plots showing cell perimeter is decreased (e) and circularity is increased (F) in uq23ks mutants compared with siblings. G:Fluorescence intensity measurement across short diameter of cells (as depicted in phalloidin staining inset) showing poor correlation between Alcama and F‐actin in siblings but strong correlation in uq23ks mutants.