
|
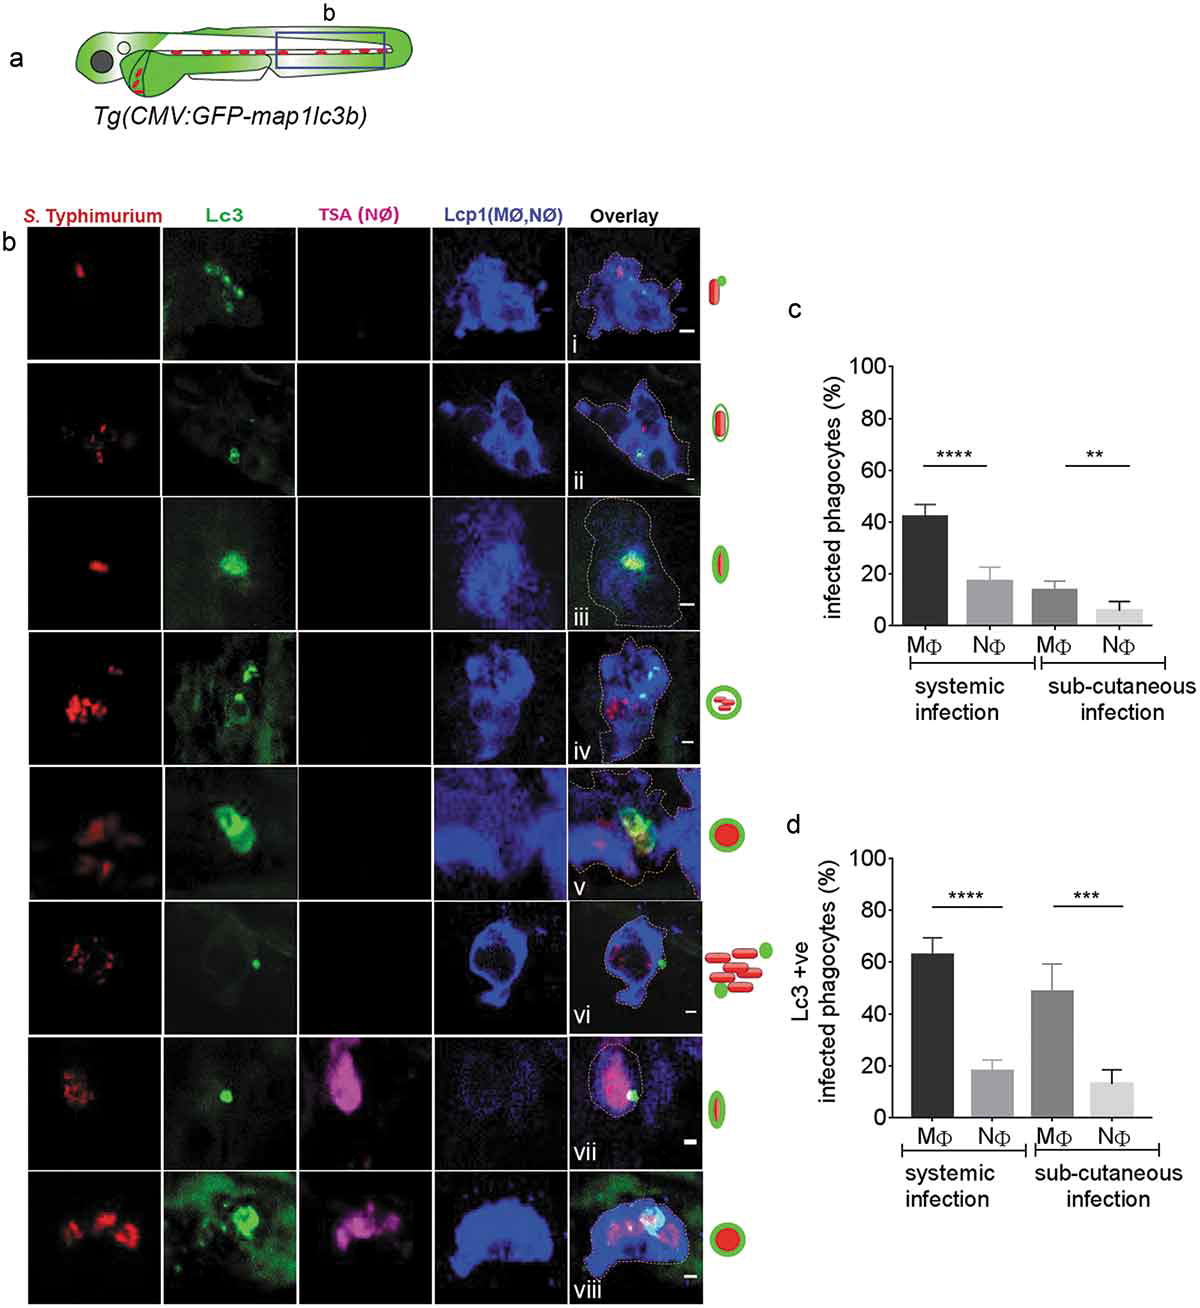
Fig. 3
GFP-Lc3–Salmonella associations in specific phagocyte types. (a) Region of interest (blue square) for confocal images of infected phagocytes in the blood circulation in b. (b) Confocal micrographs in series (i–viii) of distinctive patterns of GFP-Lc3 associations with mCherry-expressing S. Typhimurium in macrophages (MΦ, TSA negative/Lcp1 positive; i-vi) and neutrophils (NΦ, TSA positive/Lcp1 positive; vii,viii). The dotted lines in the overlay image of the separate channels indicate the cellular boundaries. The symbolic presentations shown next to the images refer to the different types of GFP-Lc3-Salmonella associations presented in Figure 2(b). (c) Quantification of phagocytosing activity of macrophages and neutrophils in systemic and sub-cutaneous infections at 4 hpi. Numbers of infected and non-infected phagocytes were counted from confocal images and the percentages of infected over the total were averaged from five embryos per group. Error bars represent the SD. Macrophages (MΦ) and neutrophils (NΦ) were distinguished by anti-Lcp1 and TSA staining as in b. (d) Quantification of GFP-Lc3-Salmonella associations in macrophages and neutrophils at 4 hpi. Numbers of infected phagocytes positive or negative for GFP-Lc3-Salmonella associations were counted from confocal images and the percentages of Lc3-positive over the total were averaged from five embryos per group. Error bars represent the SD. Macrophages (MΦ) and neutrophils (NΦ) were distinguished by anti-Lcp1 and TSA staining as in b. Scale bars: b = 2 μm. ****P < 0.0001, ***P < 0.001, **P < 0.01.