
Image
|
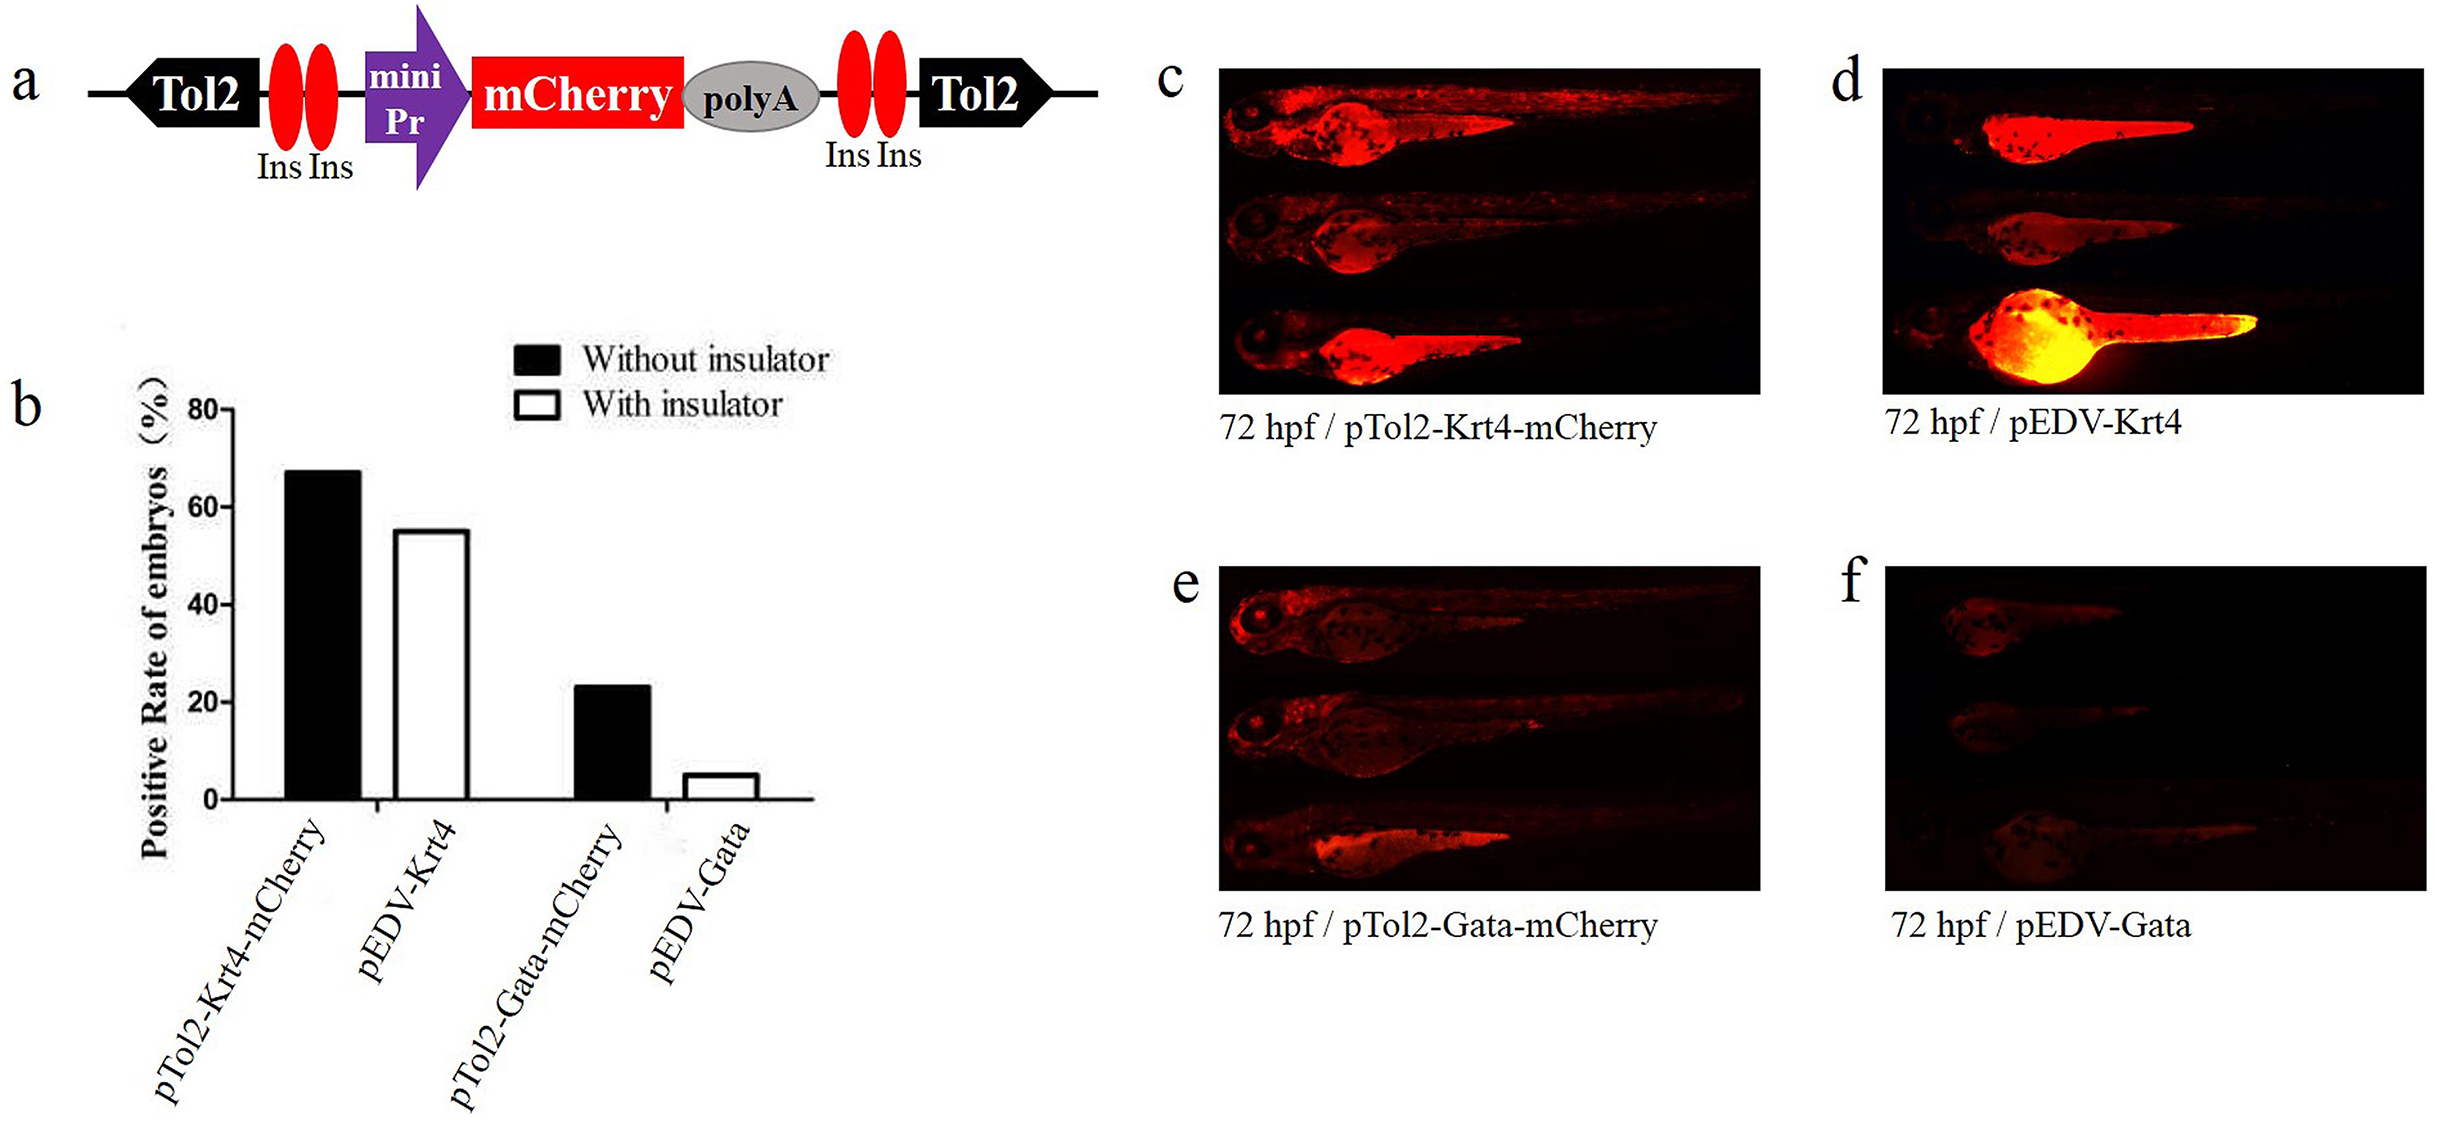
Figure Caption
Fig. 2
Functional assay of the chicken “5′HS4” insulators in the enhancer-detection vector.
(A) Diagram of the zebrafish enhancer detection vector (pEDV). The frame contains two copies of the chicken “5′HS4” insulators (Ins, shown in red ovals), which flanked the ET box. (B) mCherry expression rate among embryos injected with the four vectors at 72 hpf: two vectors that included insulators (pEDV-Krt4 and pEDV-Gata) and two vectors that did not include insulators (pTol2-Krt4-mCherry and pTol2-Gata-mCherry). (C–F) mCherryexpression in the embryos injected with the various vectors.
Acknowledgments
This image is the copyrighted work of the attributed author or publisher, and
ZFIN has permission only to display this image to its users.
Additional permissions should be obtained from the applicable author or publisher of the image.
Full text @ Peer J.