
Image
|
Figure Caption
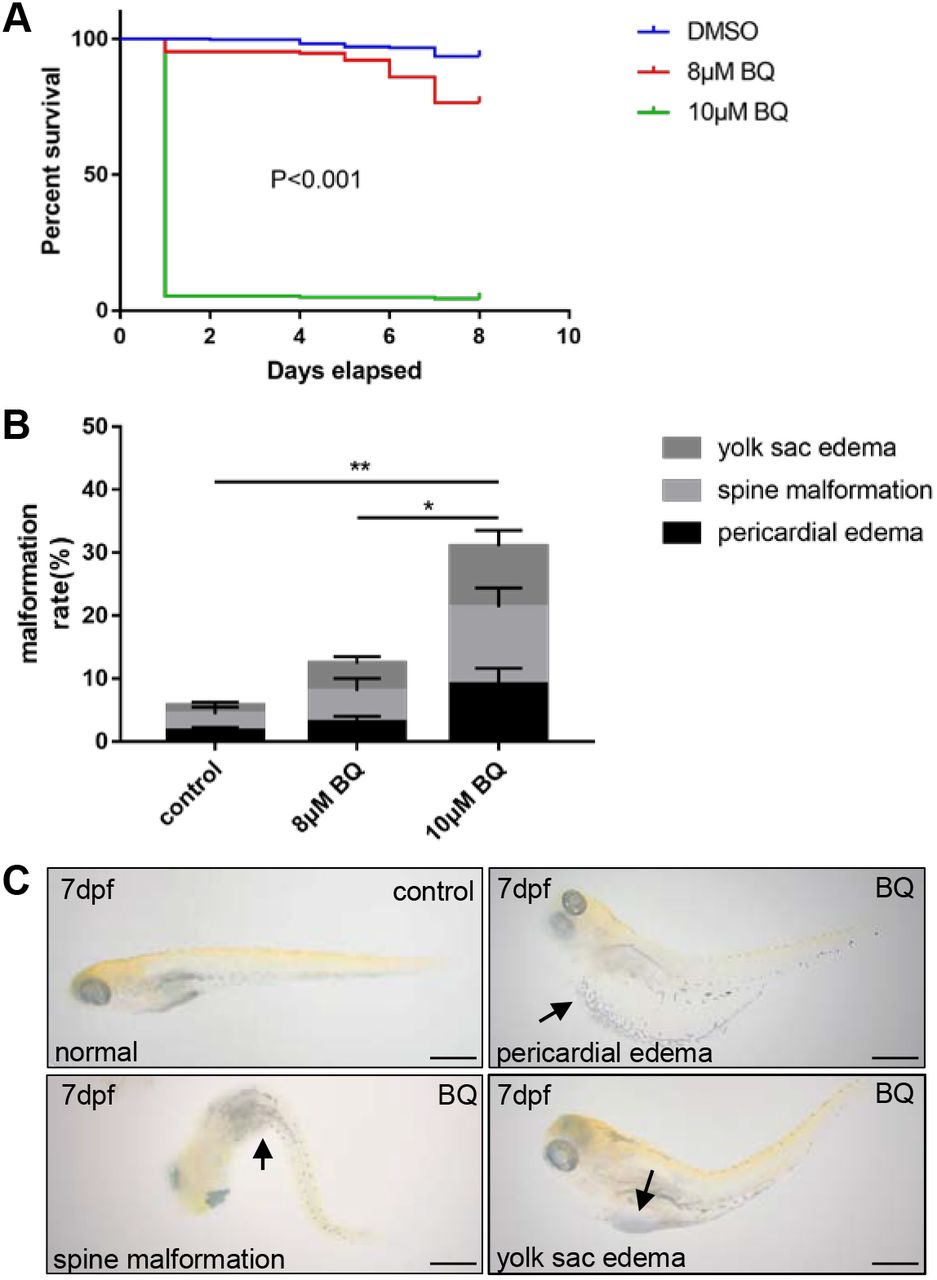
Fig. 1
Kaplan–Meier survival curve and analysis of zebrafish embryo phenotype following exposure to 1,4-benzoquinone (BQ). (A) Survival rates in zebrafish embryos following continuous exposure to BQ (n=278 per group) in the range 8–10 μM, from 2 dpf to 9 dpf (log-rank test, P<0.001). (B) Phenotypic traits (indicated by the arrows in C) observed following BQ exposure (Chi-squared test, mean±s.d., *P<0.05, **P<0.01). (C) Typical malformations were observed in zebrafish embryos exposed to BQ. Scale bars: 500 μm.
Acknowledgments
This image is the copyrighted work of the attributed author or publisher, and
ZFIN has permission only to display this image to its users.
Additional permissions should be obtained from the applicable author or publisher of the image.
Full text @ Dis. Model. Mech.