
Image
|
Figure Caption
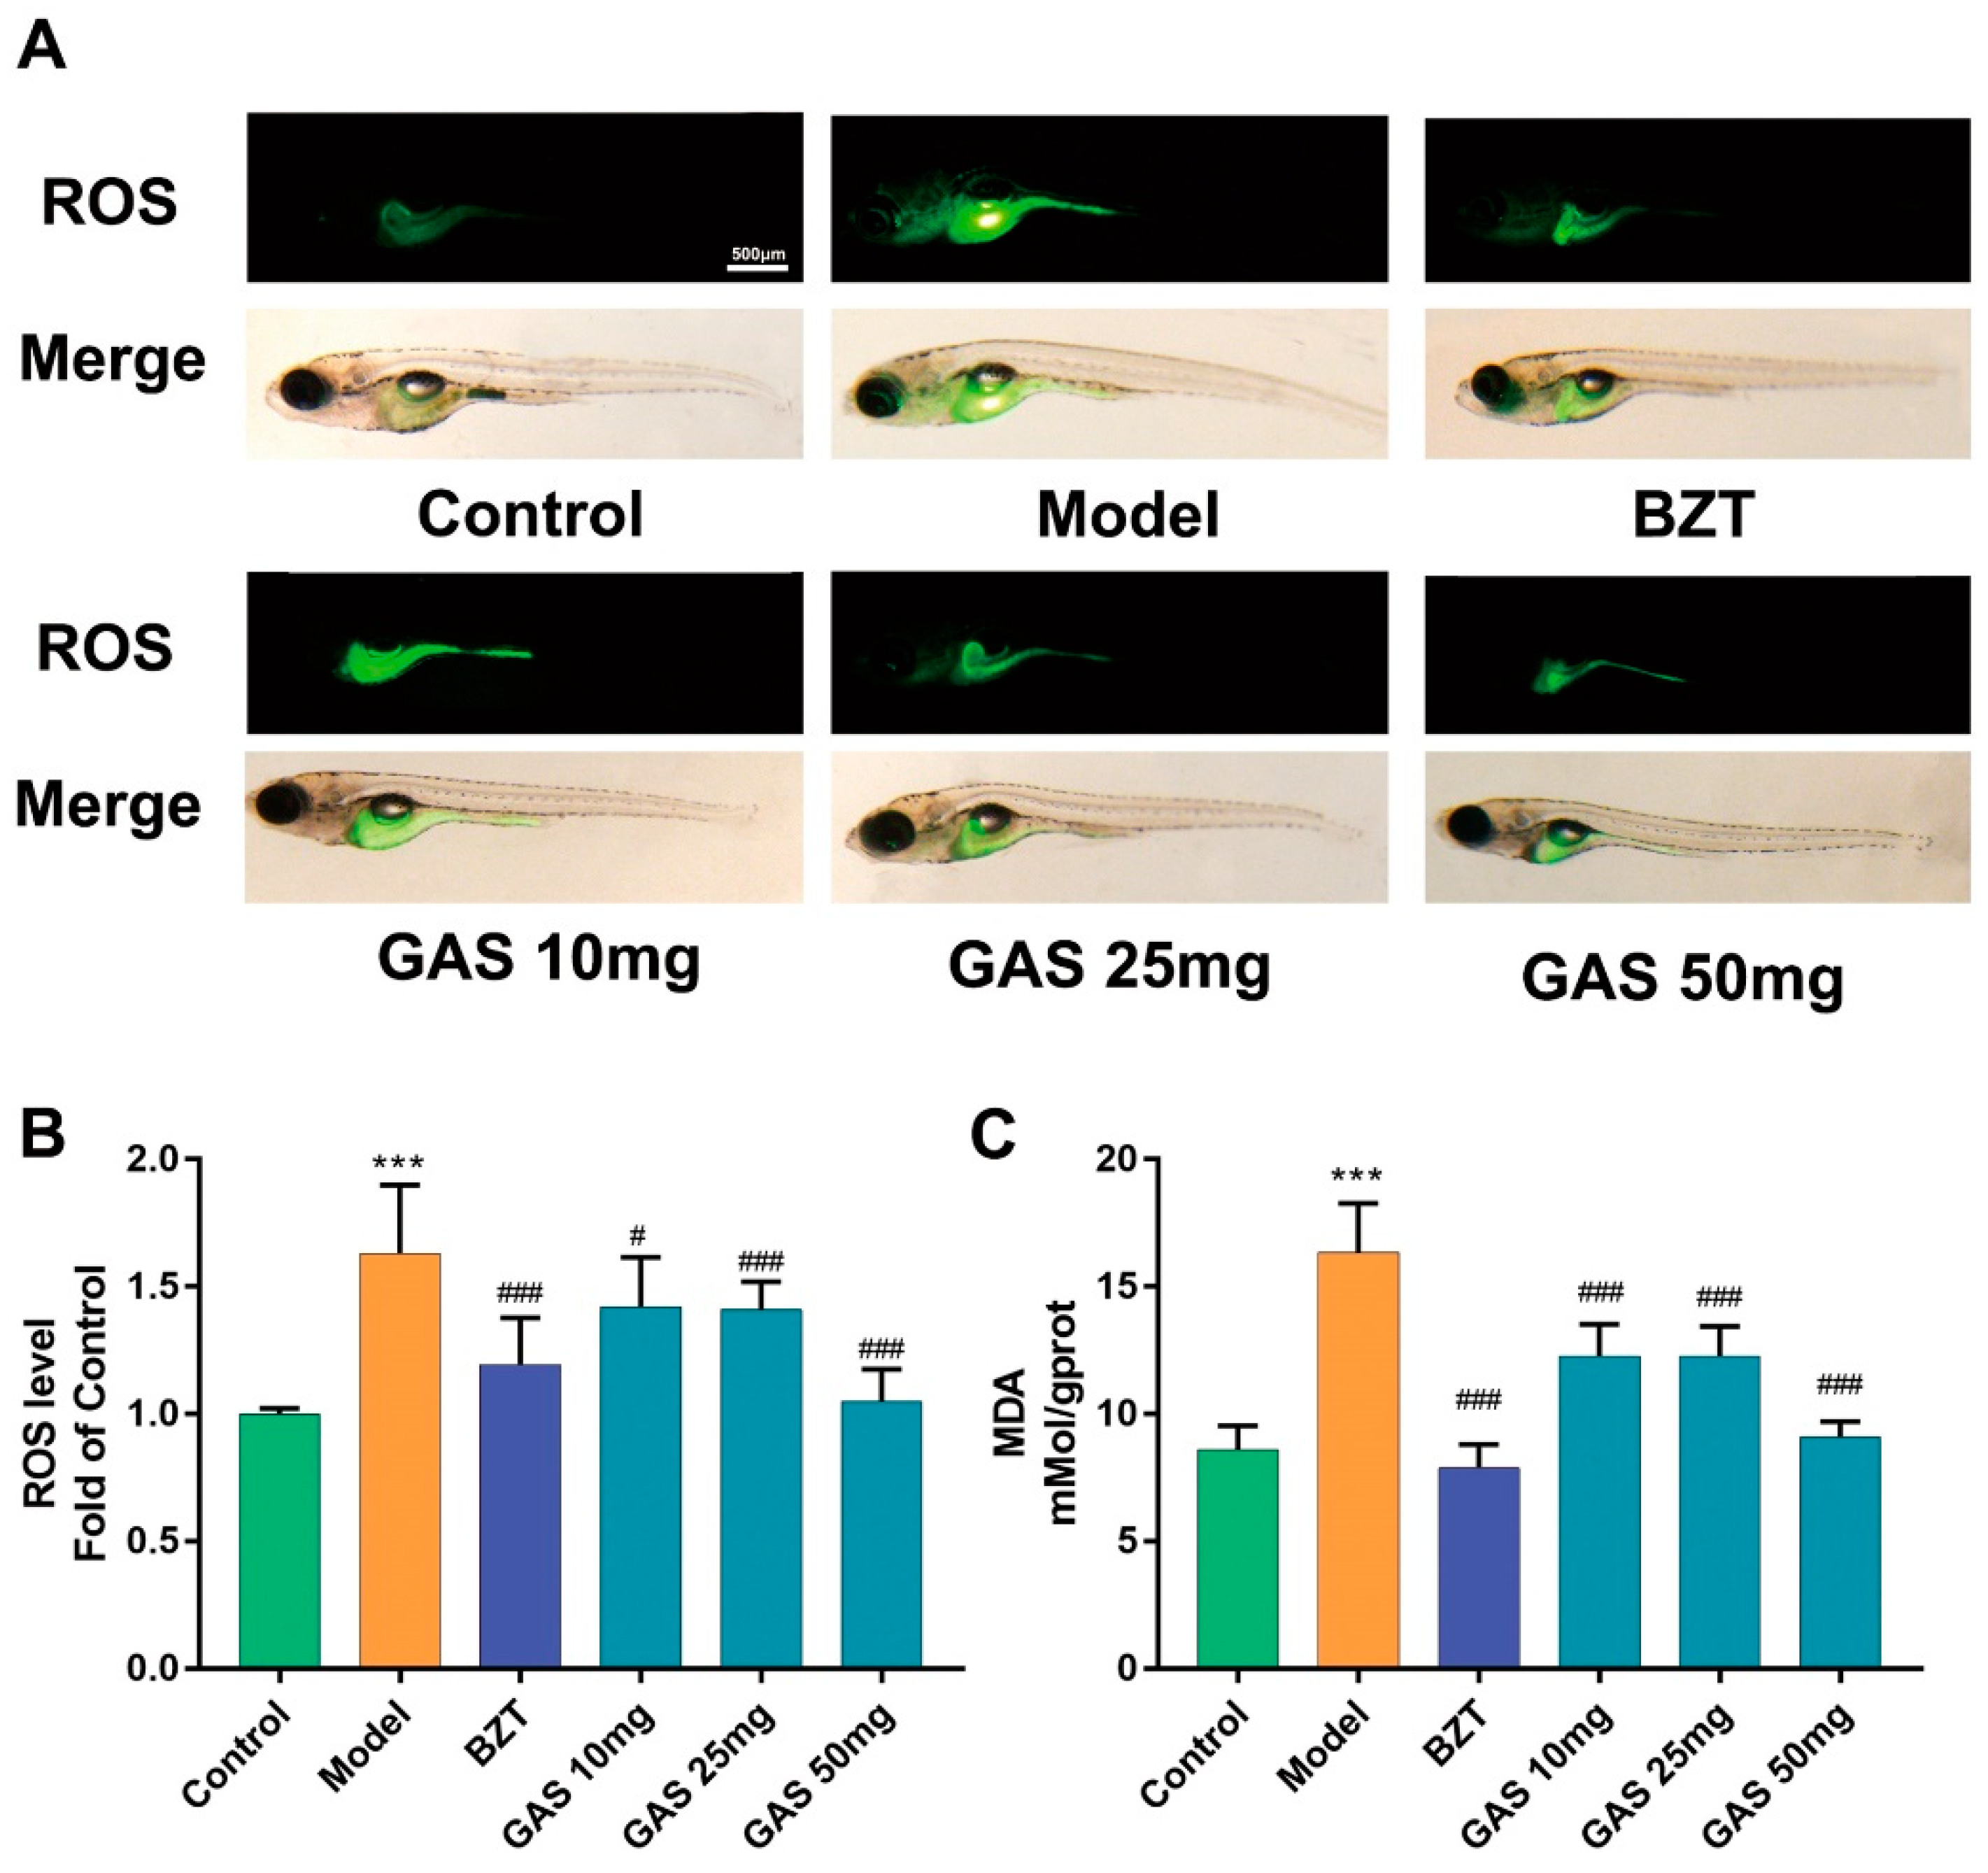
Fig. 4
The anti-oxidant stress effect of GAS on HCD induced larval zebrafish. (A) The ROS production showed in fluorescence image and merged with a light field image. (B,C) Quantitation of reactive oxygen species C malondialdehyde (ROS. C. MDA) of each treated larval zebrafish group. Bar indicate means ± SD. *** p < 0.001 represent compared with the control. # p < 0.05, ### p < 0.001 represent compared with Model. p < 0.05 was considered as statistically significant, as calculated by One-way ANOVA followed by Tukey’s test. (n = 30).
Figure Data
Acknowledgments
This image is the copyrighted work of the attributed author or publisher, and
ZFIN has permission only to display this image to its users.
Additional permissions should be obtained from the applicable author or publisher of the image.
Full text @ Int. J. Mol. Sci.