
Image
|
Figure Caption
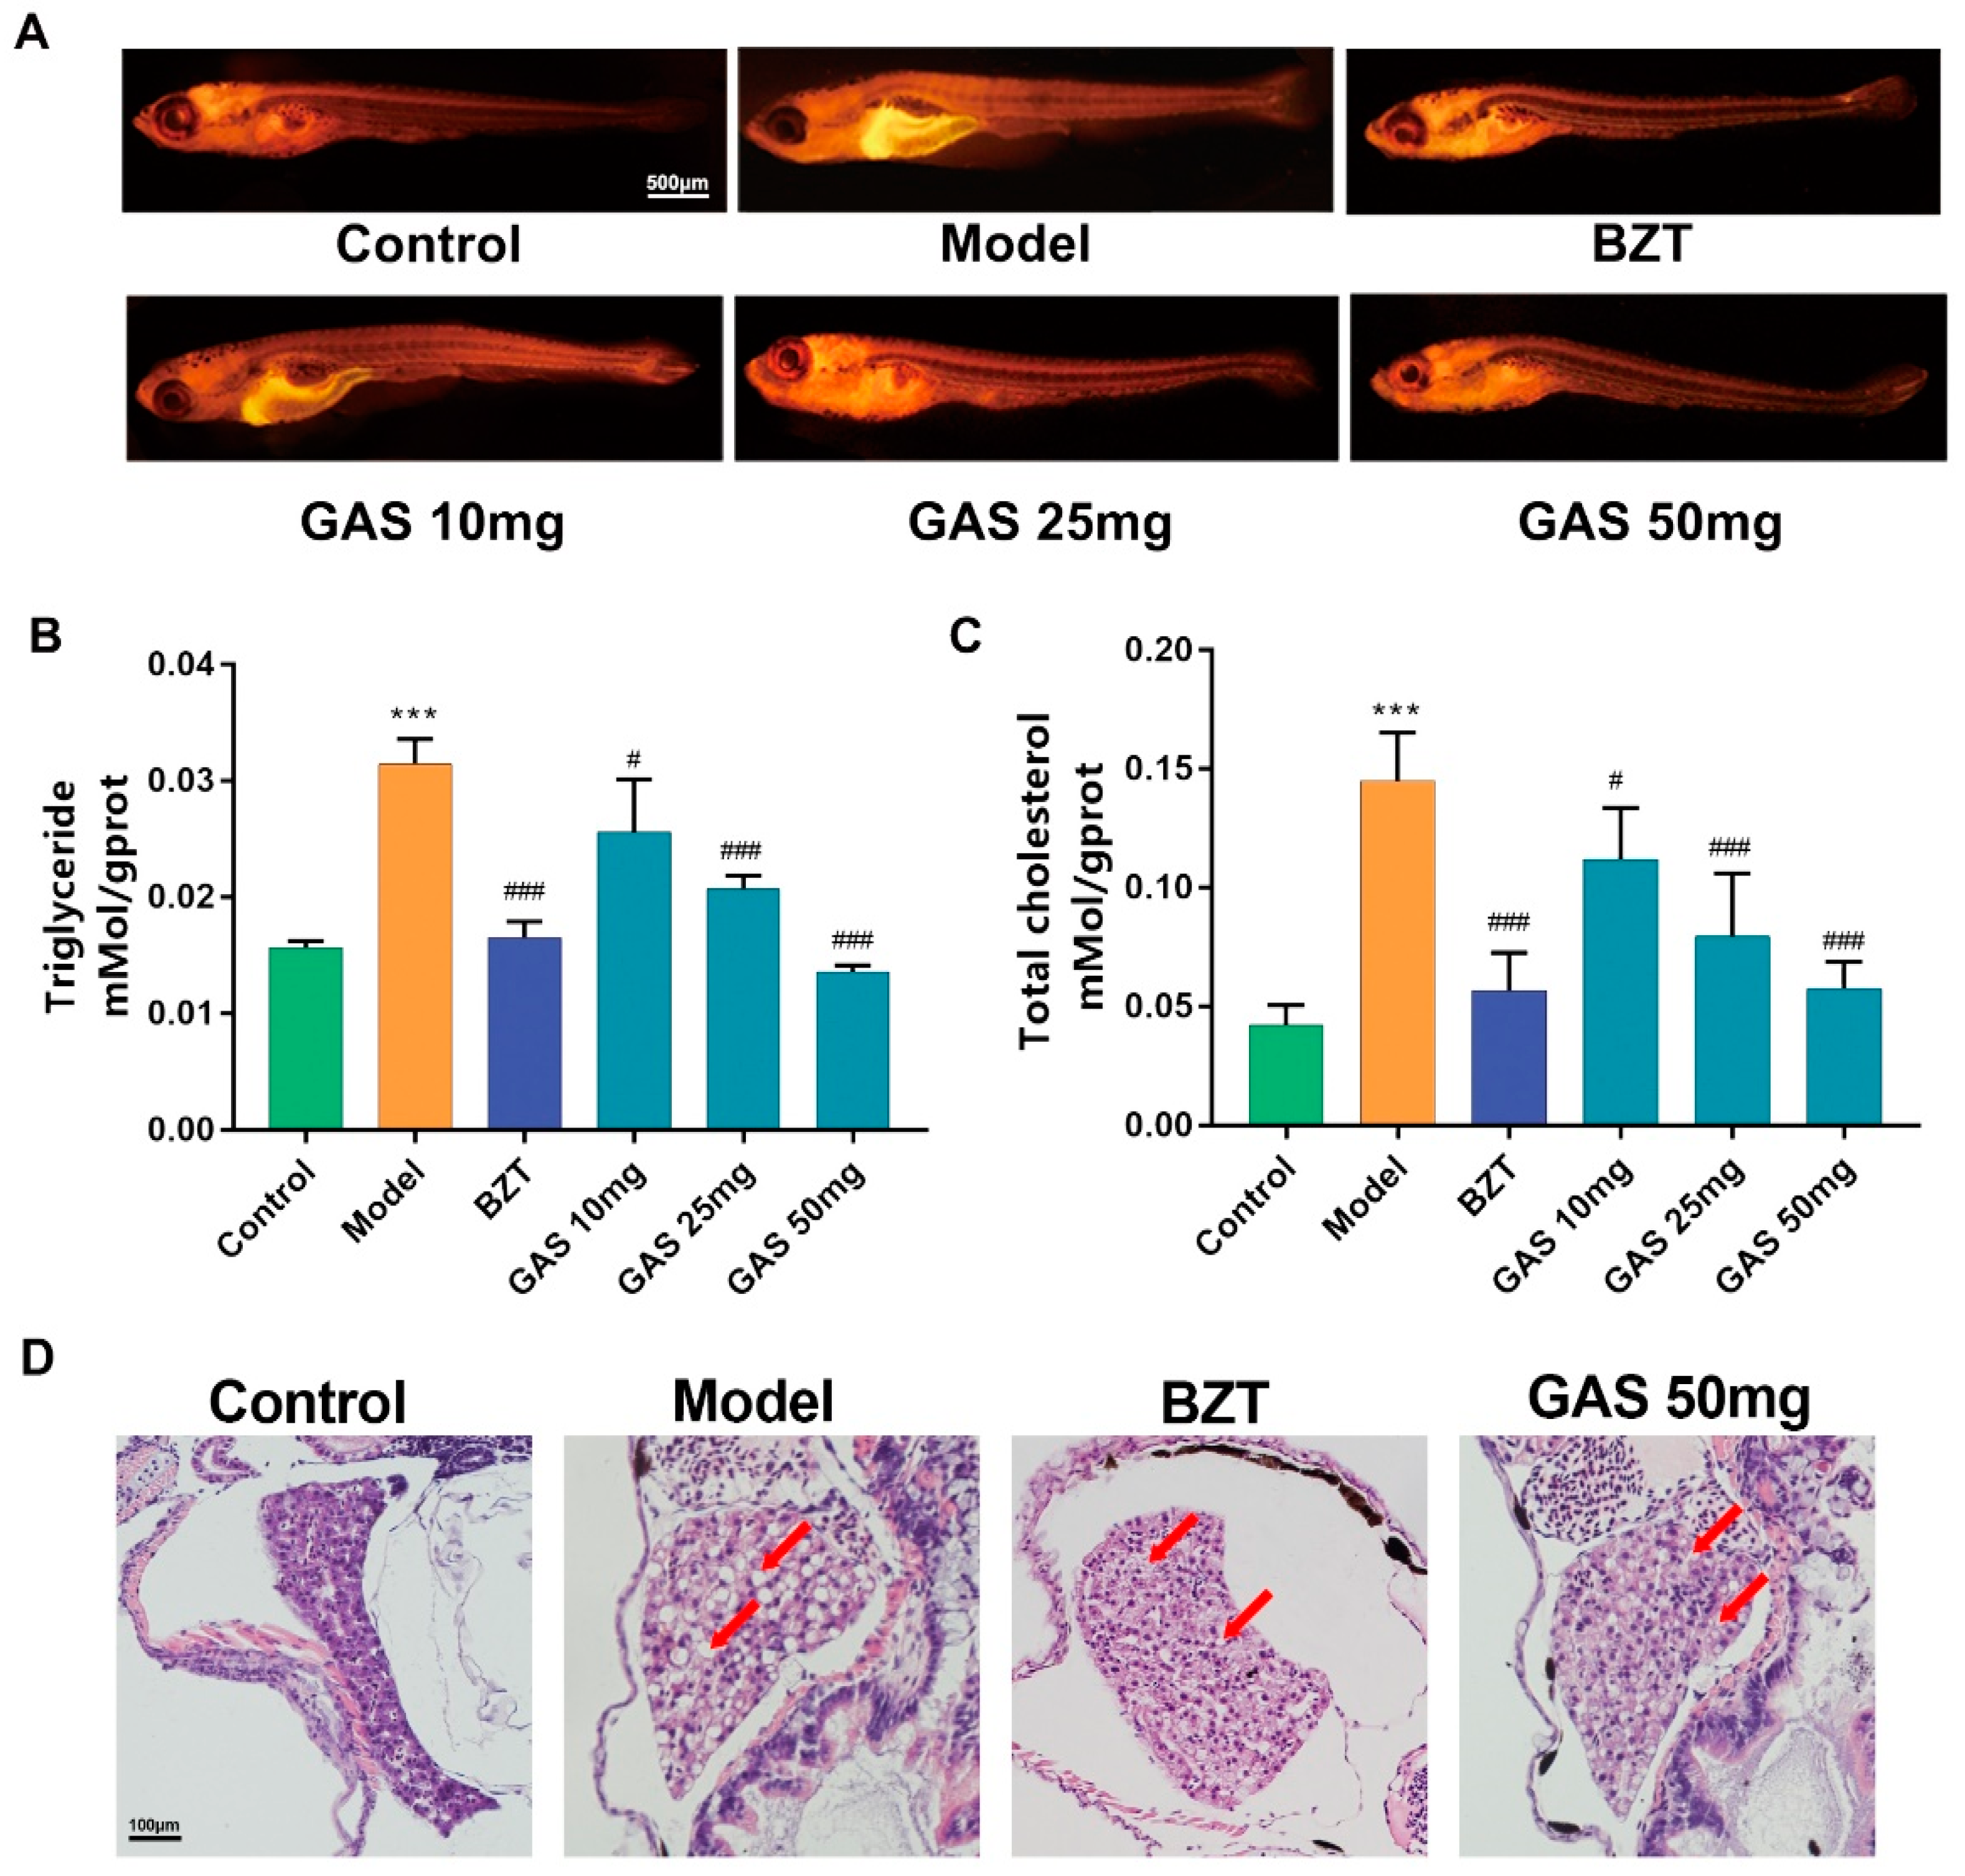
Fig. 3
Lipid is regulating the effect of GAS on HCD induced larval zebrafish. (A) Nile red stain of larval zebrafish; (B) Triglyceride (TG) levels; and (C) total cholesterol (TC) levels of larval zebrafish in each group. (D) hematoxylin and eosin (HE) staining of larval zebrafish liver, macrovesicular steatosis and the differences mentioned with red arrows. Bar indicate means ± SD. *** p < 0.001 represent compared with the control. # p < 0.05, ### p < 0.001 represent compared with Model. p < 0.05 was considered as statistically significant, calculated by One-way ANOVA, followed by Tukey’s test. (n = 30).
Figure Data
Acknowledgments
This image is the copyrighted work of the attributed author or publisher, and
ZFIN has permission only to display this image to its users.
Additional permissions should be obtained from the applicable author or publisher of the image.
Full text @ Int. J. Mol. Sci.