
Image
|
Figure Caption
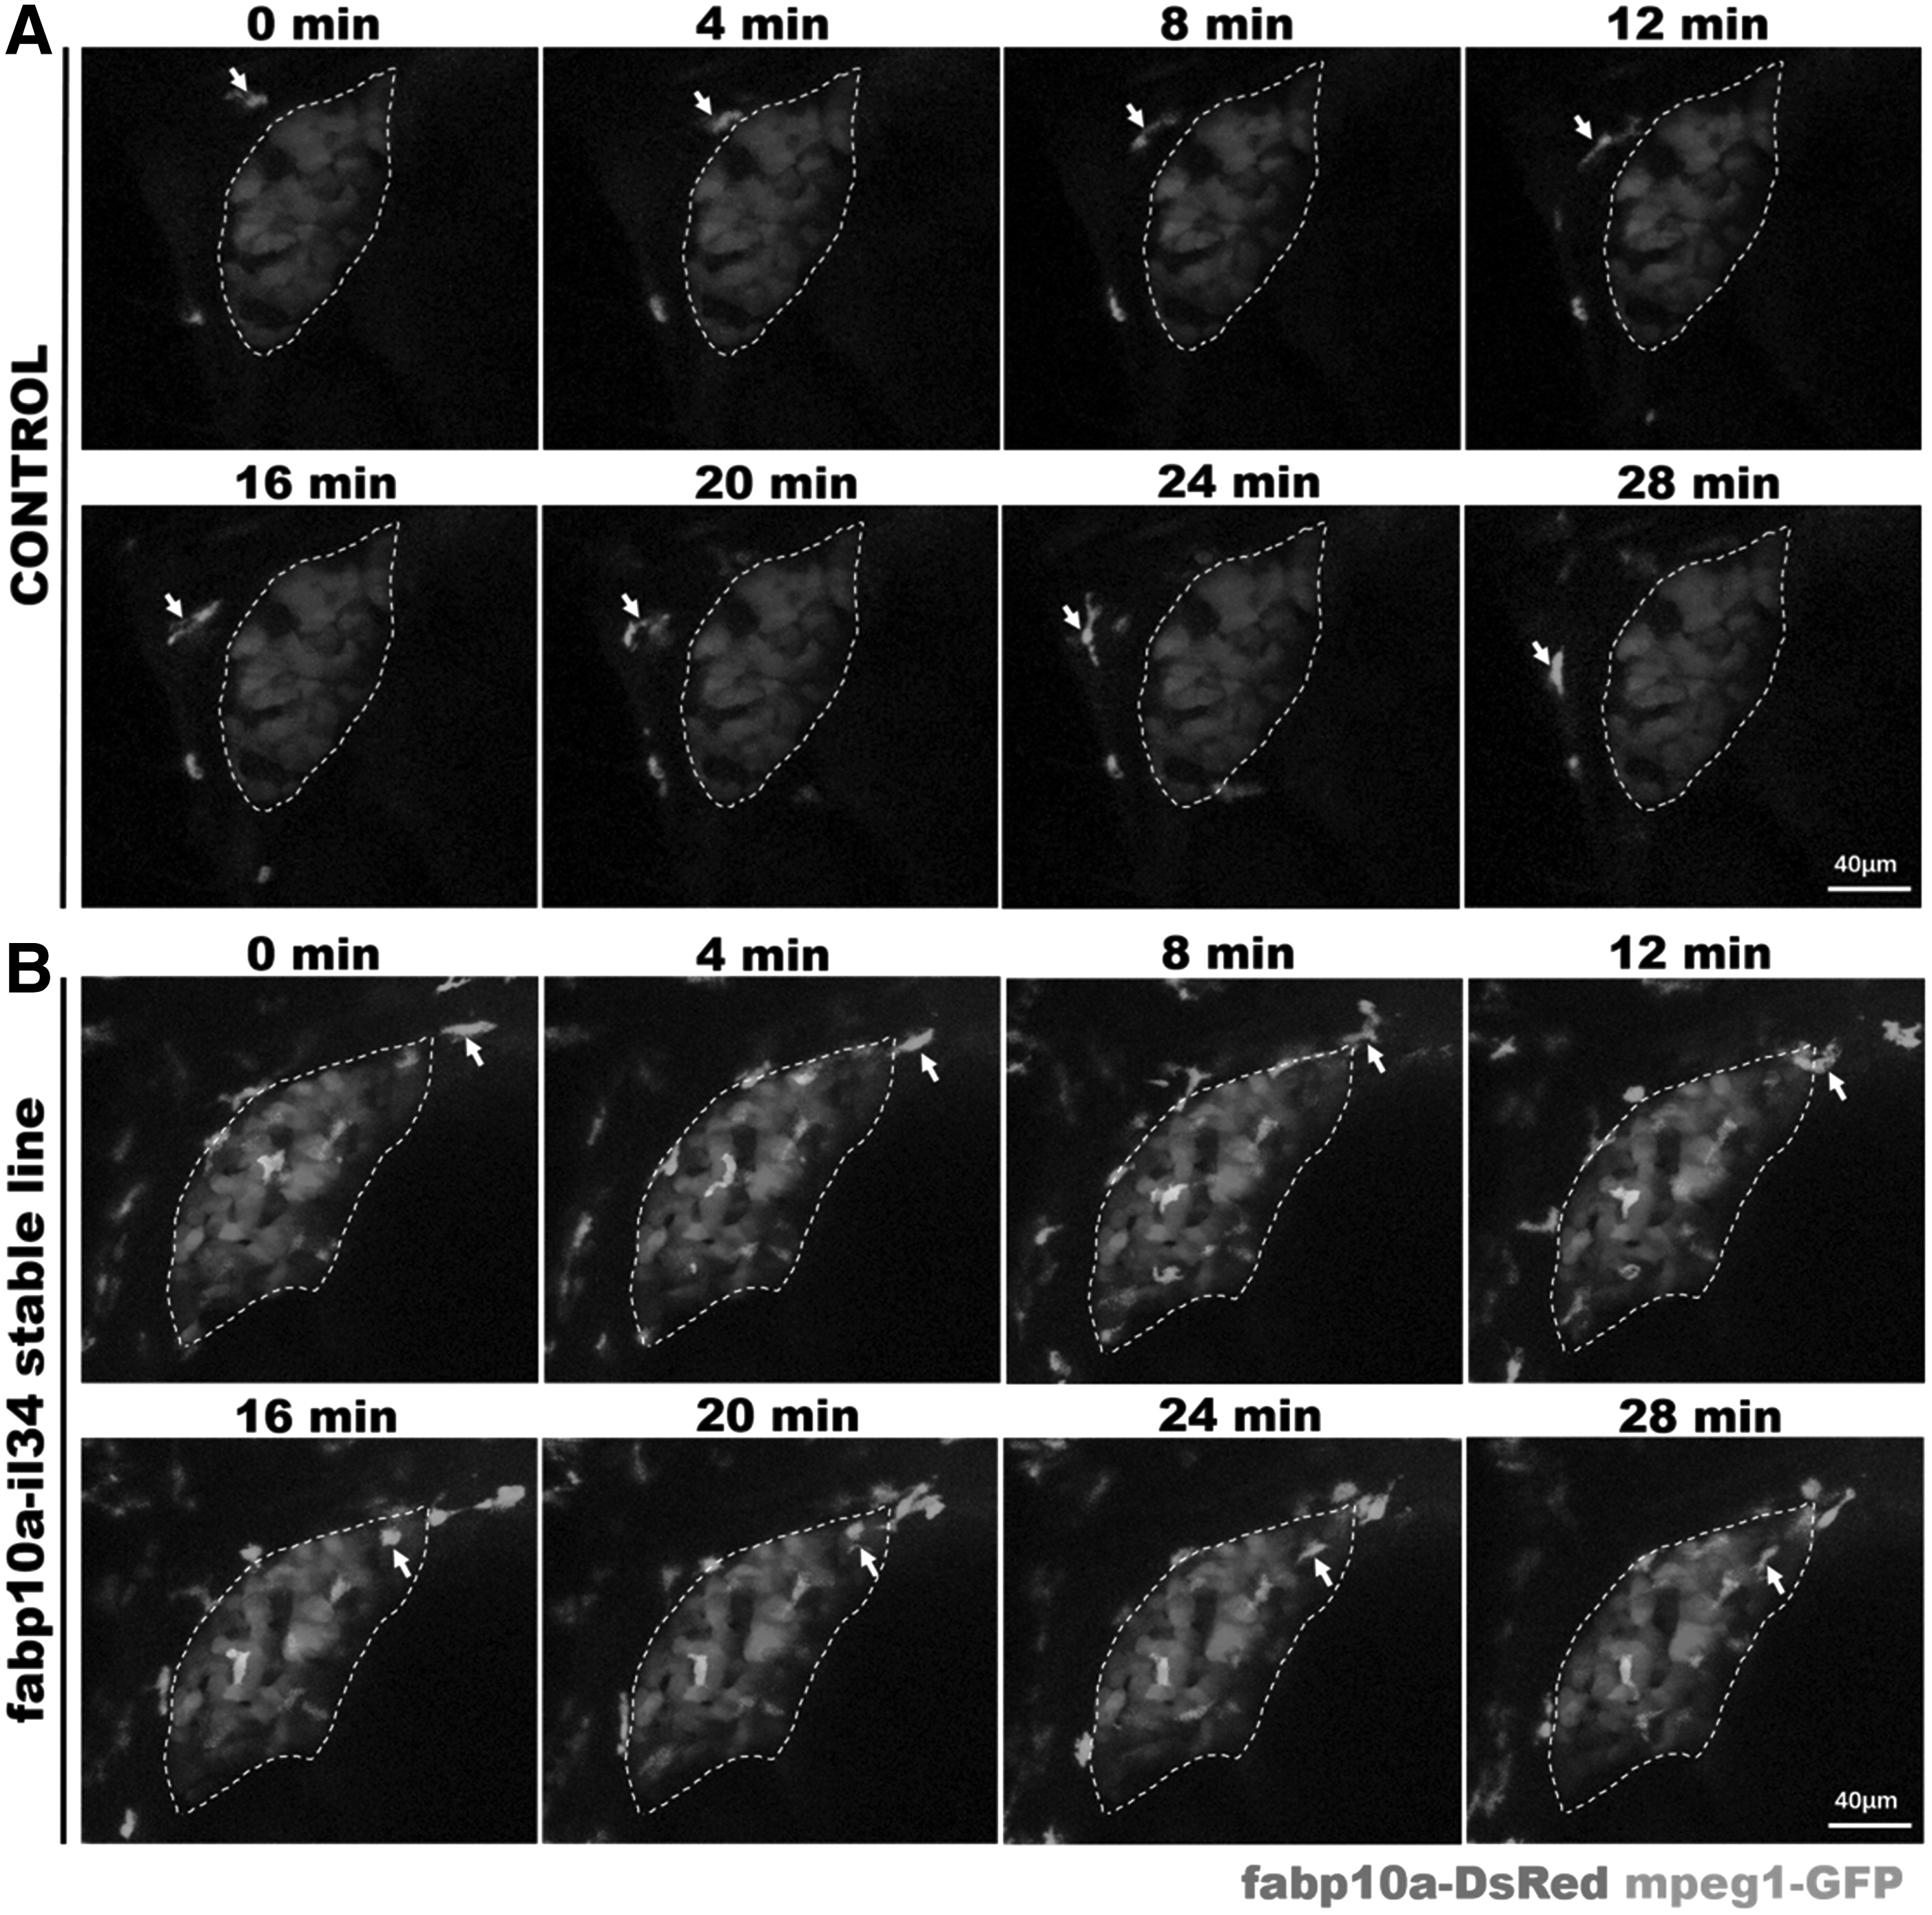
Fig. 4
Overexpression of IL-34 led to macrophage migration to the liver. Micrographs of live imaging show the process of a macrophage (labelled by white arrows) passing by the liver (white dotted area) within 28 minutes in control fish (A) and the process of a macrophage (labelled by white arrows) migrating into the liver (white dotted area) within 28 minutes in IL-34 overexpressing fish (B). Bars: 40 μm (white line).
Figure Data
Acknowledgments
This image is the copyrighted work of the attributed author or publisher, and
ZFIN has permission only to display this image to its users.
Additional permissions should be obtained from the applicable author or publisher of the image.
Full text @ Zebrafish