
|
Fig. 3
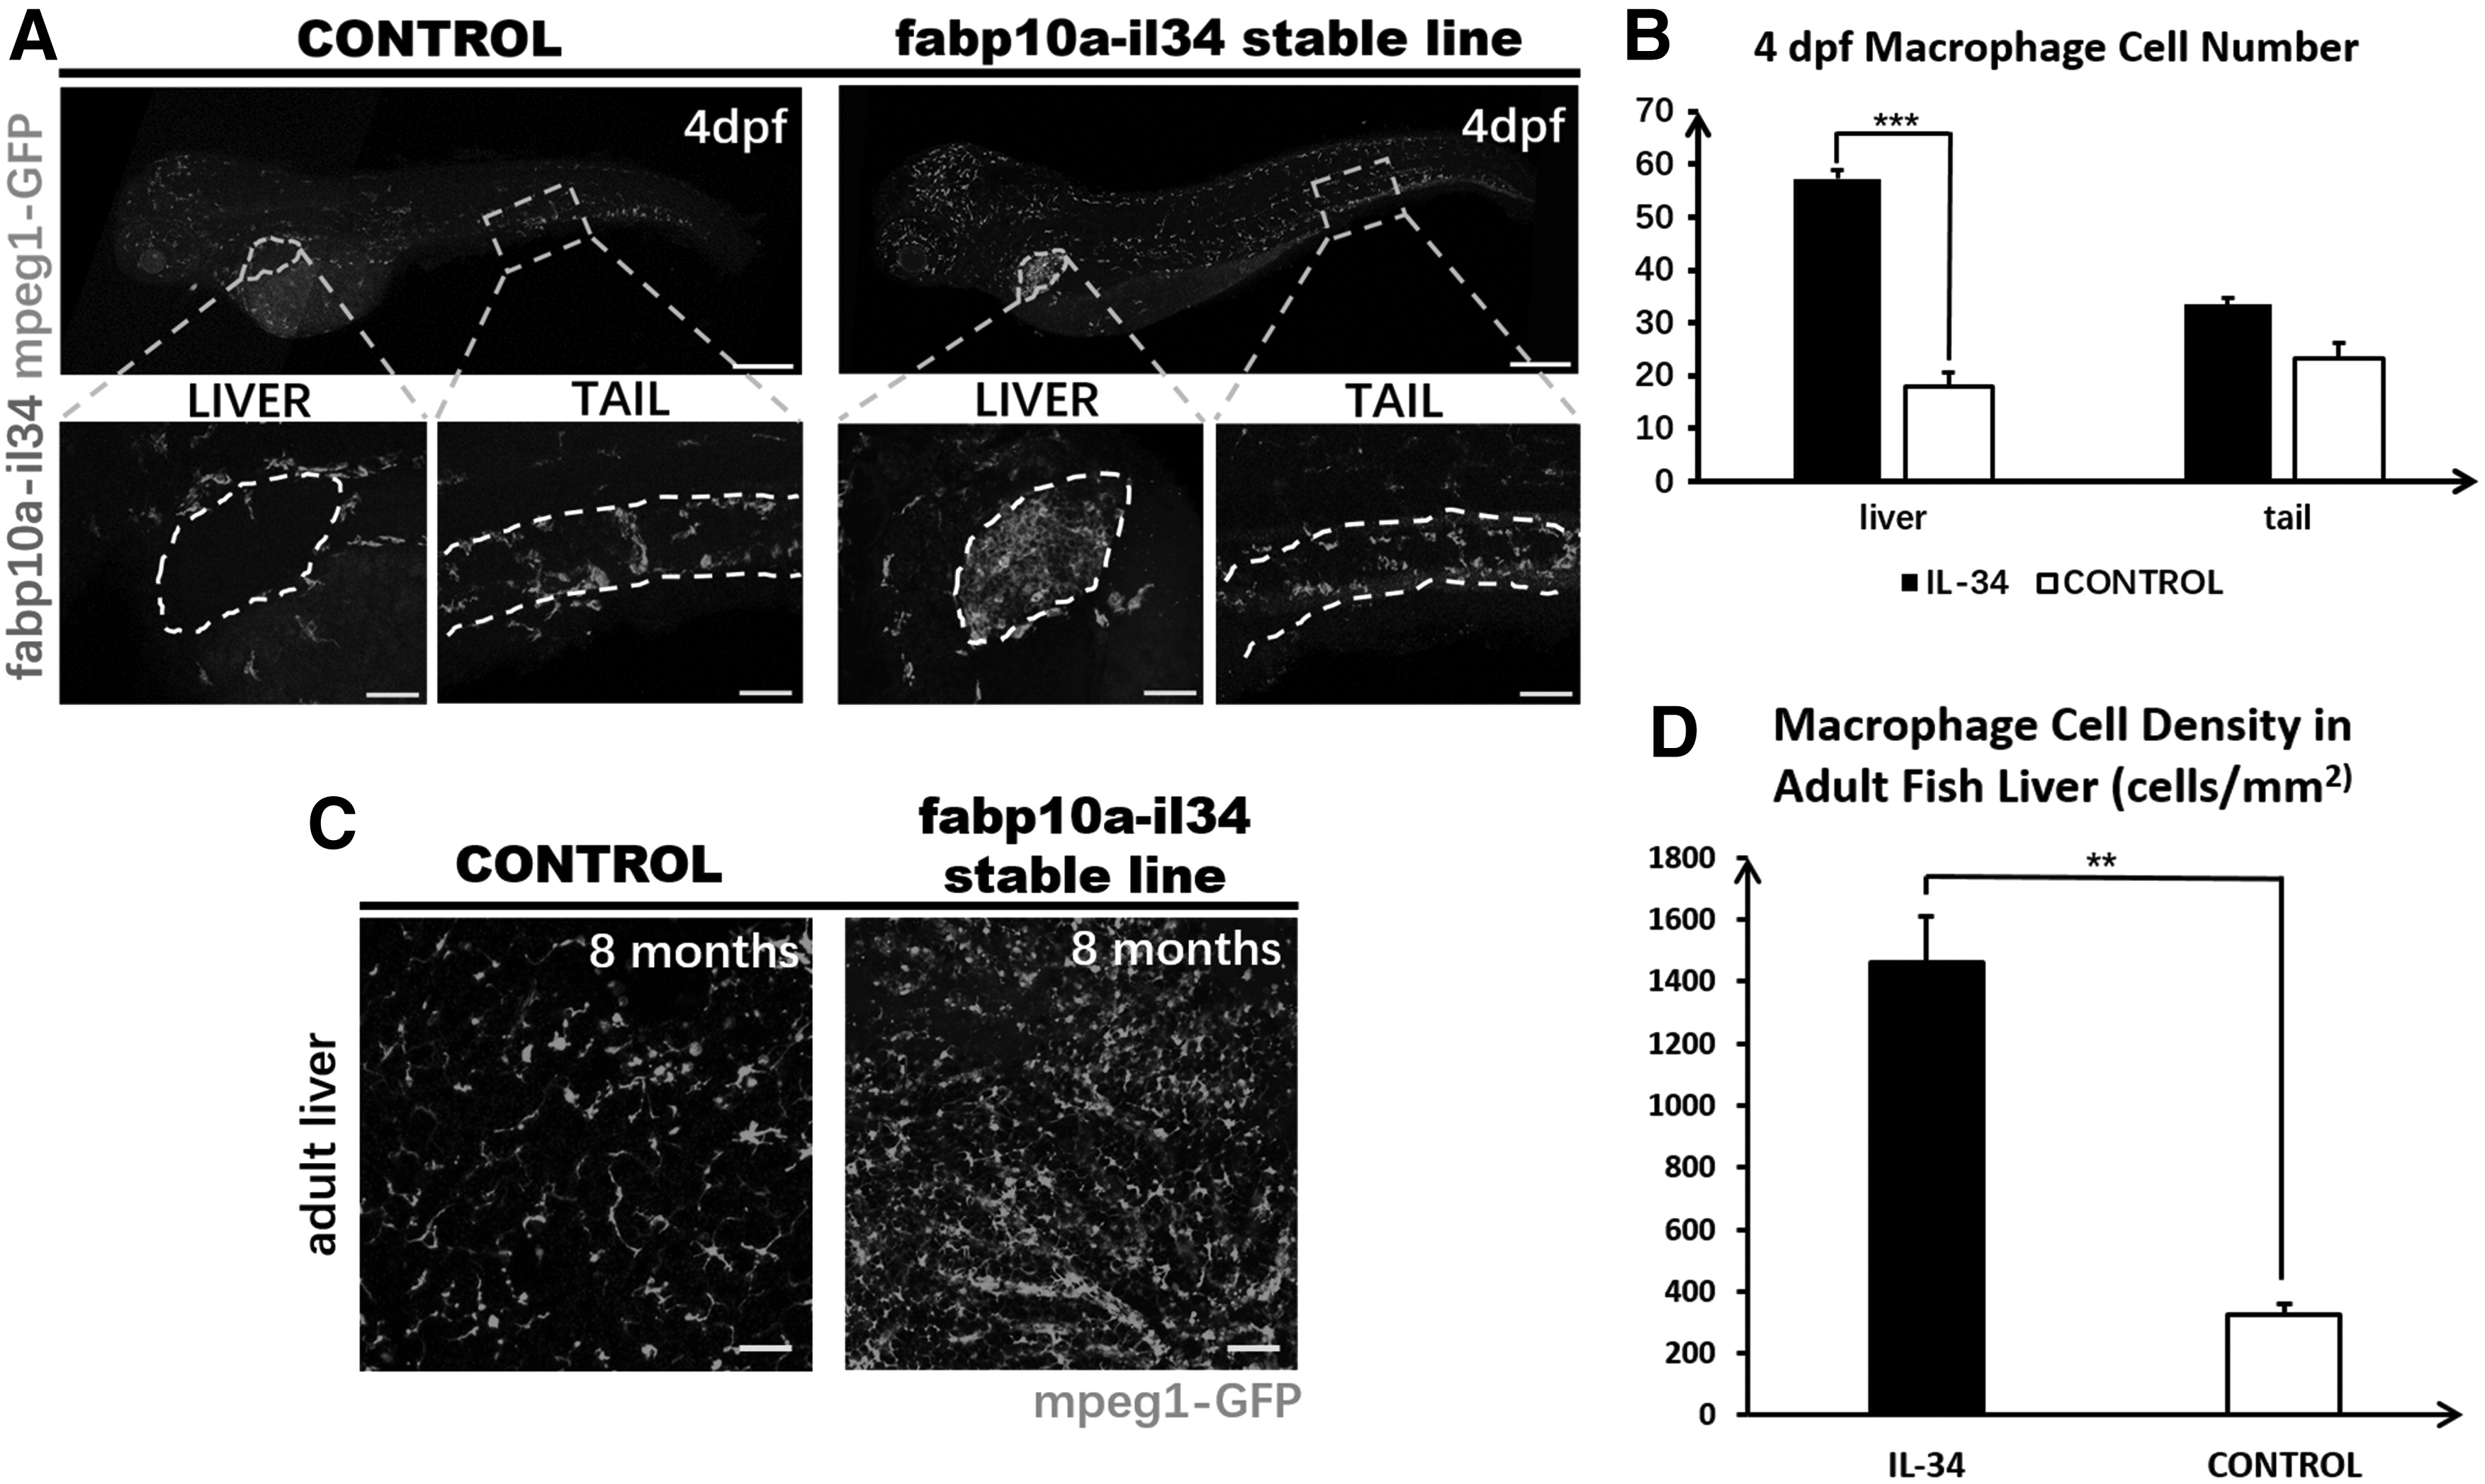
Stably overexpressed IL-34 in liver led to macrophage enrichment in liver. (A) WISH of il34 expression and whole-mount antibody staining of GFP expression in 4 dpf embryo (6 × ). The whole body picture of the fish is made up of two separate images taken by confocal and stitched together in the Photoshop. Insets are high magnification (20 × ) of the corresponding boxed regions (gray dotted areas). (B) Quantitative analysis of macrophage cell numbers in Tg (mpeg1: GFP) and Tg (fabp10a: il34; mpeg1: GFP) embryos' liver (shown in white dotted area) and CHT tail region (approximately between the 13th and 17th somite, shown between two white dotted lines). (C) Liver confocal imaging of Tg (mpeg1: GFP) and Tg (fabp10a: il34; mpeg1: GFP) in 8-month-old fish (20 × ). (D) Quantitative analysis of macrophage cell numbers in the livers of Tg (mpeg1: GFP) and Tg (fabp10a: il34; mpeg1: GFP) adult fish. Data were analyzed by Mann–Whitney U test, **p < 0.01, and ***p < 0.001 compared to control. n = 5, 5 for the 4 dpf or 8 mpf IL-34 overexpression and control fish. Bars: 200 μm (the line on 6 times objective pictures); 50 μm (the line on 20 times objective pictures).