
|
Fig. 8
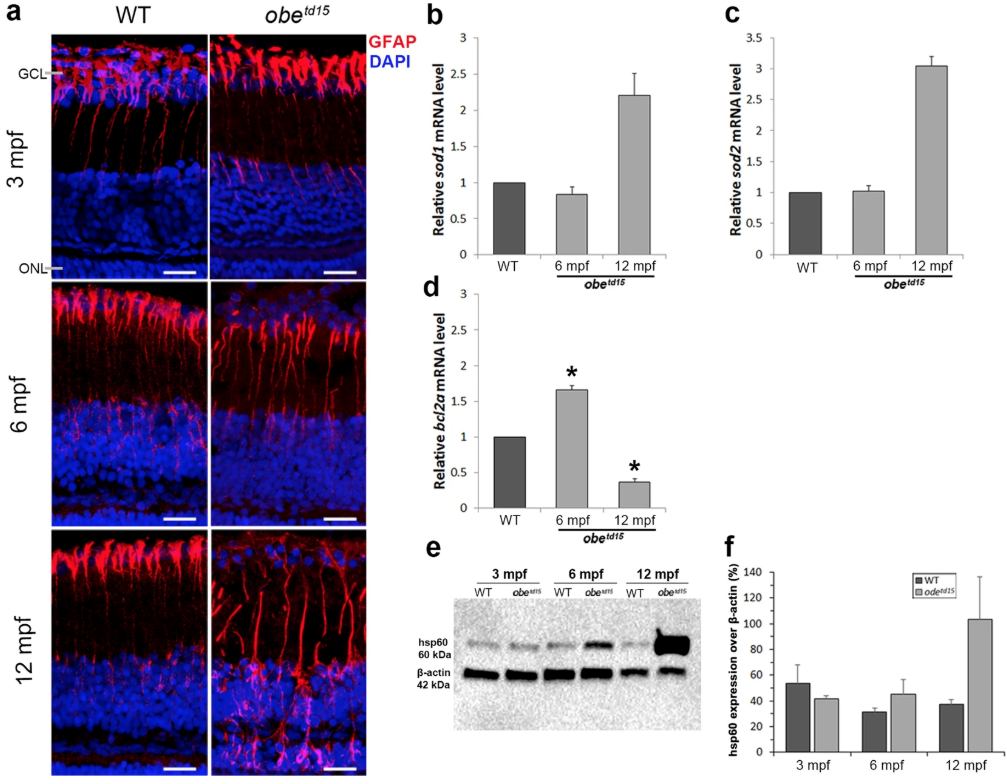
Retinal stress in obetd15 zebrafish. Immunostaining of the retina at 3, 6 and 12 mpf using anti-ZRF1 to detect expression of glial fibrillary acidic protein (red), counterstained with DAPI nucleic acid stain (blue) (a). Quantitative RT-PCR was used to determine relative mRNA expression levels of sod1 (b), sod2 (c) and bcl2a (d) genes at 6 and 12 mpf (n = 3 for each age, mean ± SEM). Western blot analysis of heat shock protein 60 (hsp60) expression (e). The blot was re-probed with anti-β-actin as a loading control for samples. Bands of interest are cropped from full-length blot presented in Supplementary Fig. S4. The bar chart (f) shows mean ± SEM result from three independent experiments. *p < 0.05. Scale bar = 50 µm.