
|
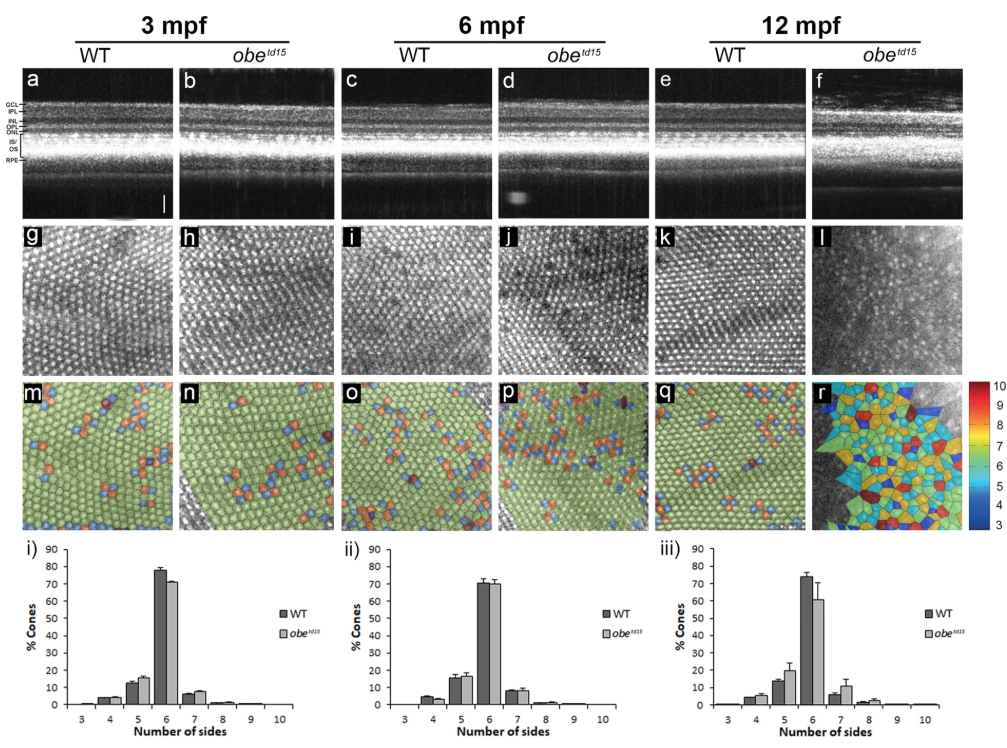
Fig. 2
Cone photoreceptor mosaic in obetd15 zebrafish. Optical coherence tomography was used at 3, 6 and 12 months post fertilization (mpf) to examine retinal cross-sectional views (a–f), en face cone photoreceptor mosaics (g–l) and corresponding Voronoi domain overlays (m–r) in which a Voronoi polygon is associated with each cone photoreceptor and color-coded according to the number of sides it possesses (color key shown on right). Bar charts showing the mean percentage of 3- to 10-sided Voronoi domains in wild-type (WT) and obetd15 zebrafish at (i) 3 mpf, (ii) 6 mpf and (iii) 12 mpf (n = 5 for each age, mean ± SEM). GCL, ganglion cell layer; IPL, inner plexiform layer; INL, inner nuclear layer; OPL, outer plexiform layer; ONL, outer nuclear layer; PR, photoreceptors; RPE, retinal pigment epithelium. Scale bar = 50 μm.