
Image
|
Figure Caption
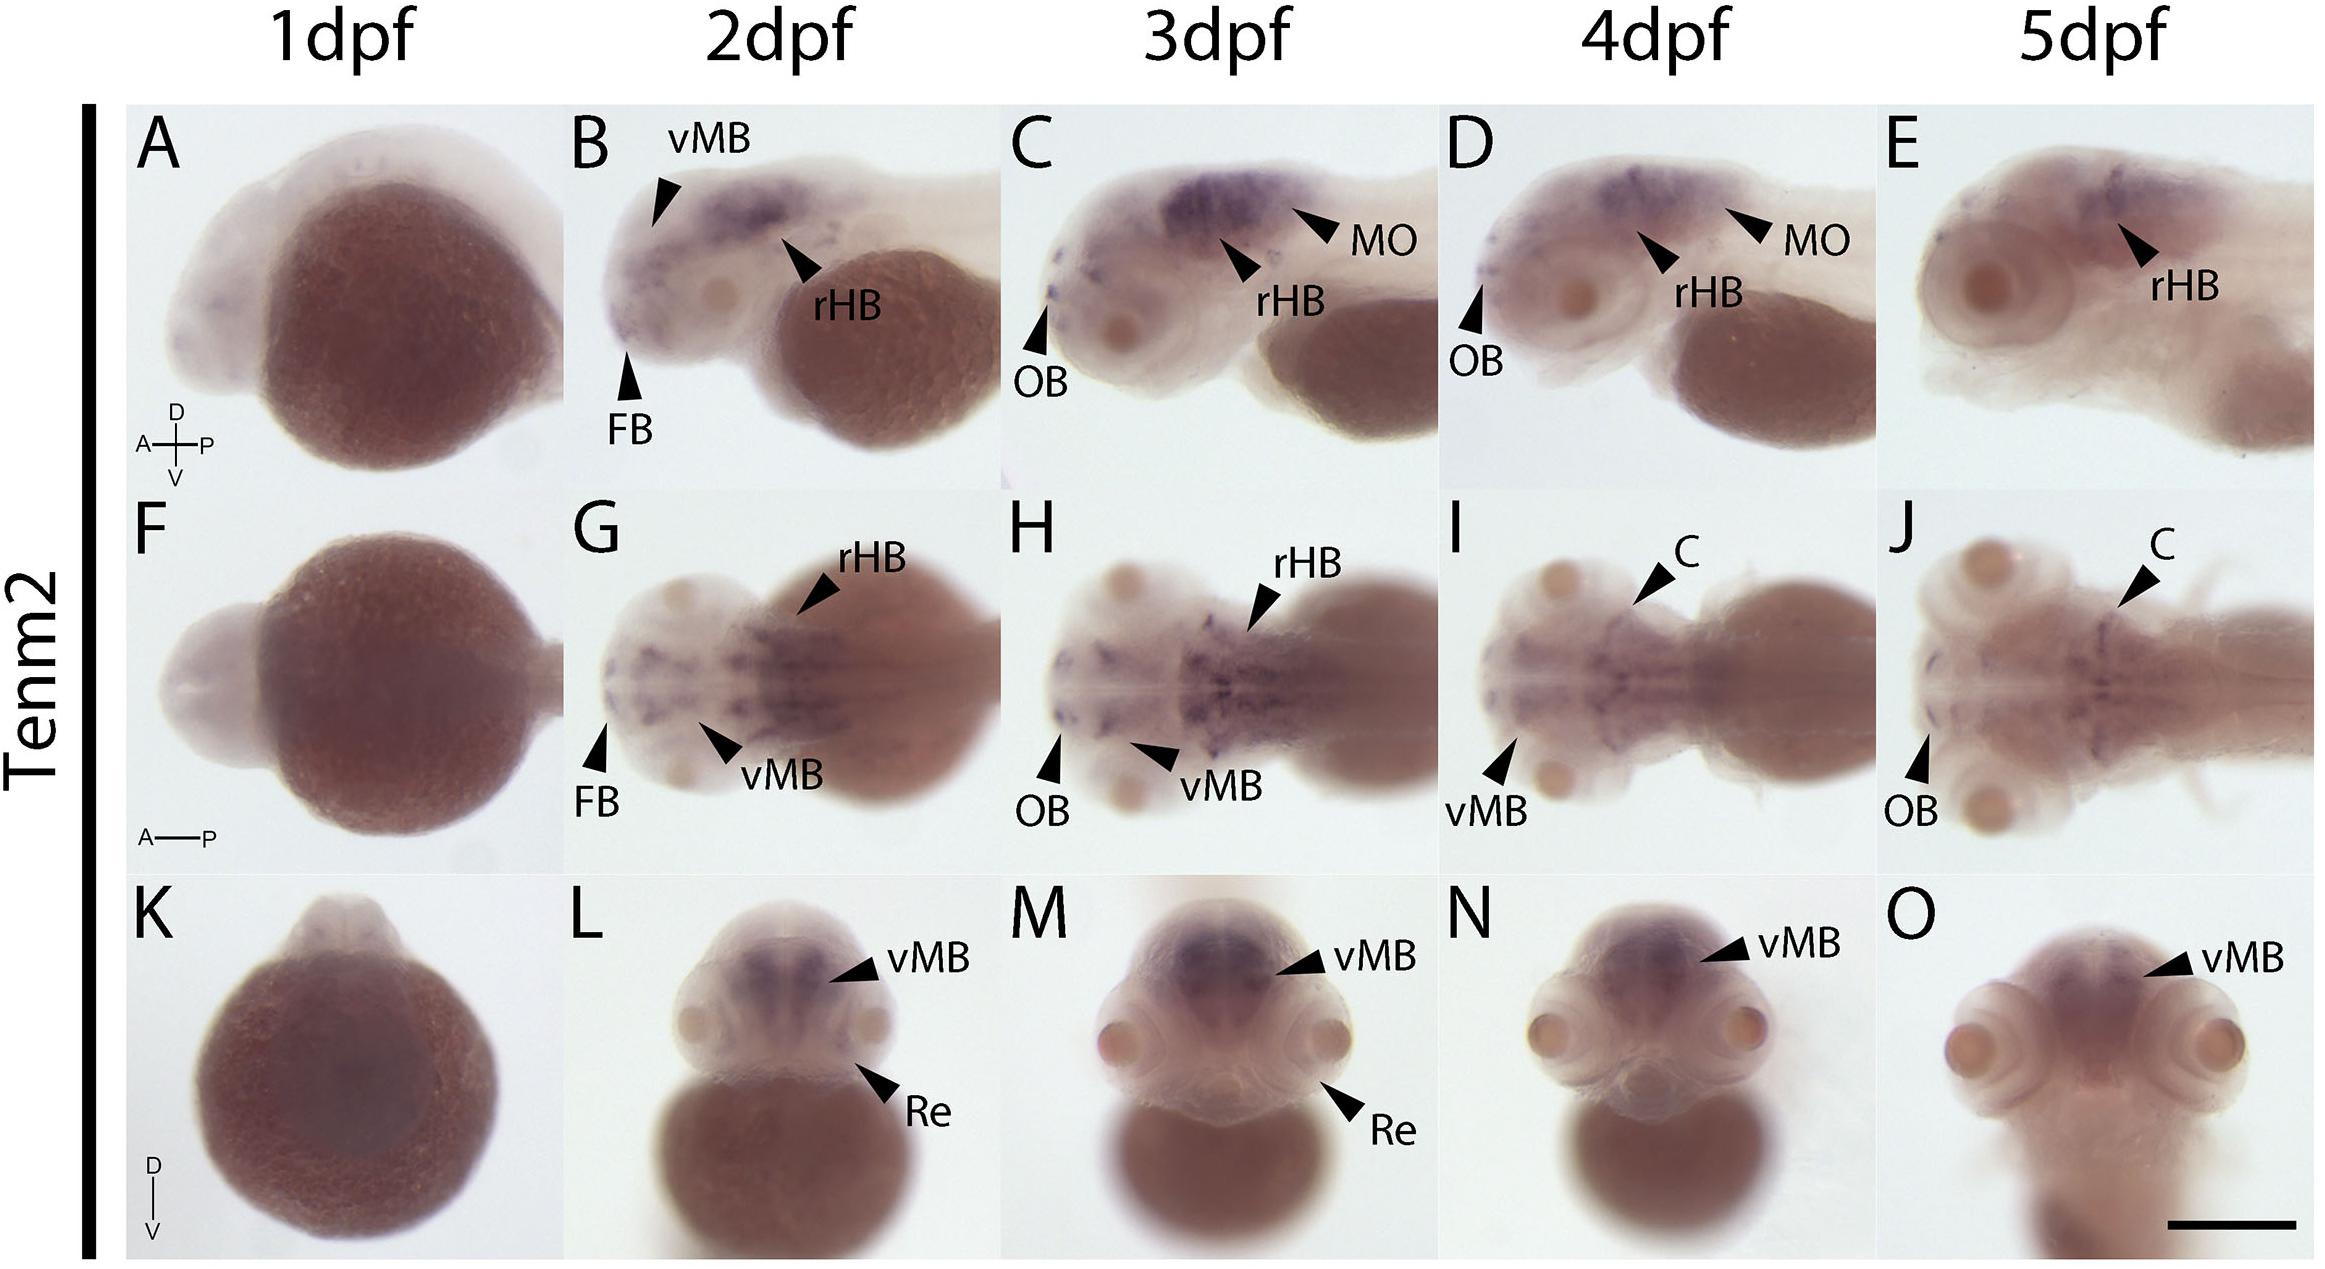
Fig. 3
Wholemount expression of tenm2 during zebrafish development. Tenm2 expression during 1–5 dpf shown from lateral (A–E), dorsal (F–J) and frontal (K–O)perspectives. A, Anterior; C, Cerebellum; D, Dorsal; FB, Forebrain; MO, Medulla Oblongata; OB, Olfactory Bulb; P, Posterior; Re, Retina; rHB, rostral Hindbrain; V, Ventral; vMB, ventral Midbrain. Scale bar in all panels = 250 μm.
Figure Data
Acknowledgments
This image is the copyrighted work of the attributed author or publisher, and
ZFIN has permission only to display this image to its users.
Additional permissions should be obtained from the applicable author or publisher of the image.
Full text @ Front. Neurosci.