
|
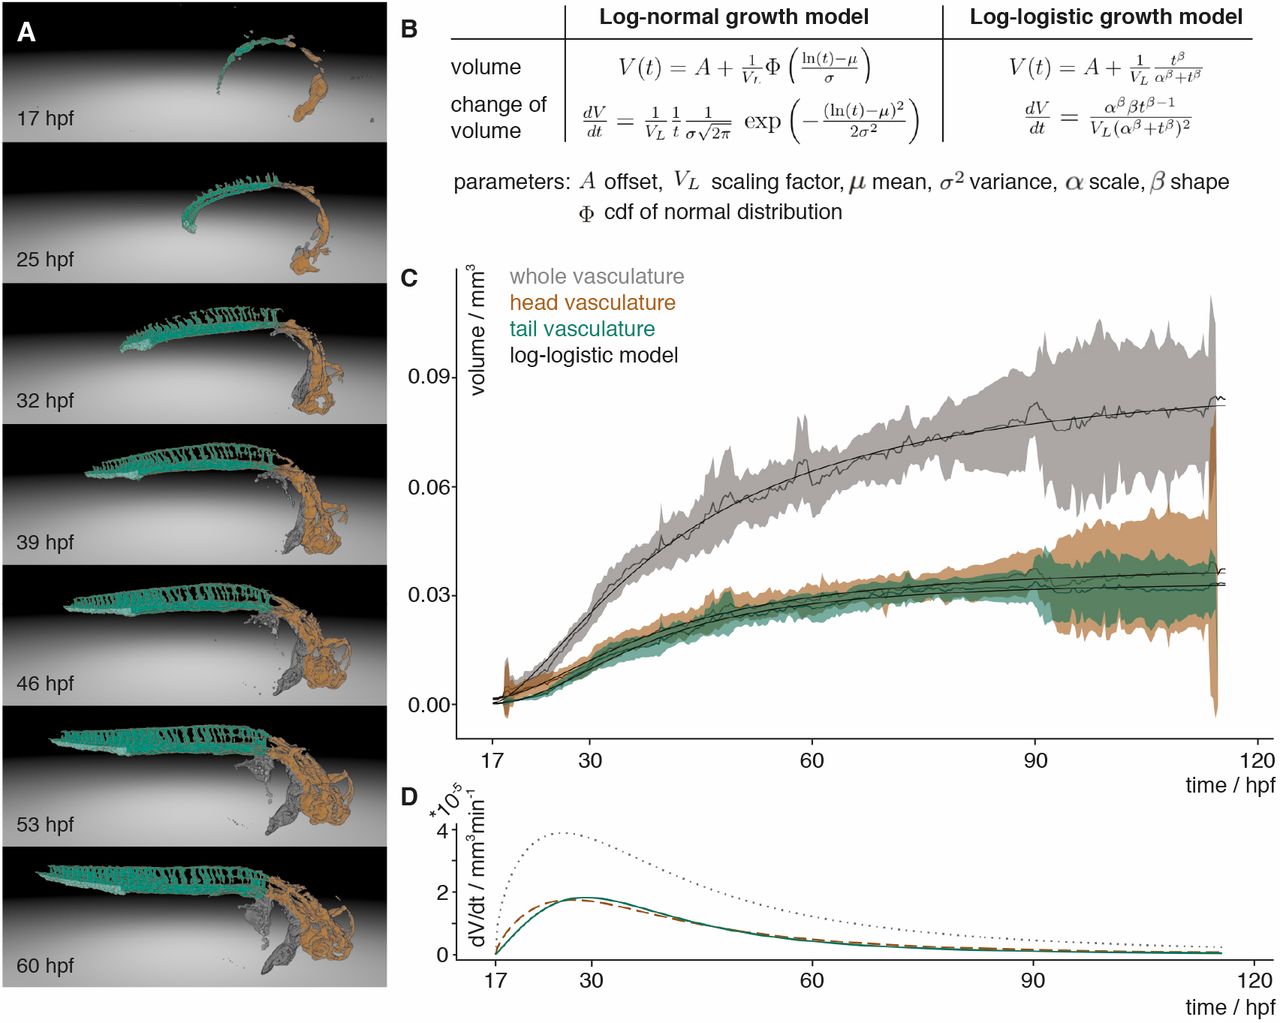
Fig. 3
Vascular volume growth characteristics of zebrafish. (A) Segmentation of the vasculature at seven different time points labelled with the annotation of the head (orange) and tail (turquoise) with its caudal vein plexus (light turquoise) and the rest of the segmented vasculature (grey). (B) Equations of the scaled cumulative log-logistic and log-normal growth models describing the volume V(t) and change of volume dV/dt over time t with offset A, scaling factor VL, mean µ and standard deviation σ of log-normal distribution and cumulative distribution function (cdf) Φ of the standard normal distribution, and log-logistic scale parameter α and shape parameter β. (C) Experimental measurements of the volume over time of the whole vasculature (grey), and the head (brown) and tail (turquoise) vasculature. The mean of the measurements is depicted with a solid line and the 95% confidence interval (t-statistics, n=7) as a ribbon in the corresponding colour. The black line depicts the approximation of the volume calculated using the scaled cumulative log-logistic growth model. The corresponding panel for the scaled cumulative log-normal model is in Fig. S10A. (D) The volume growth rate of the whole vasculature (grey, dotted), and head (brown, dashed) and tail (turquoise) vasculature was calculated by inserting the parameters obtained from the approximation into the change of volume equation of the scaled log-logistic growth model. The corresponding panel for the scaled log-normal model is in Fig. S10B.