
|
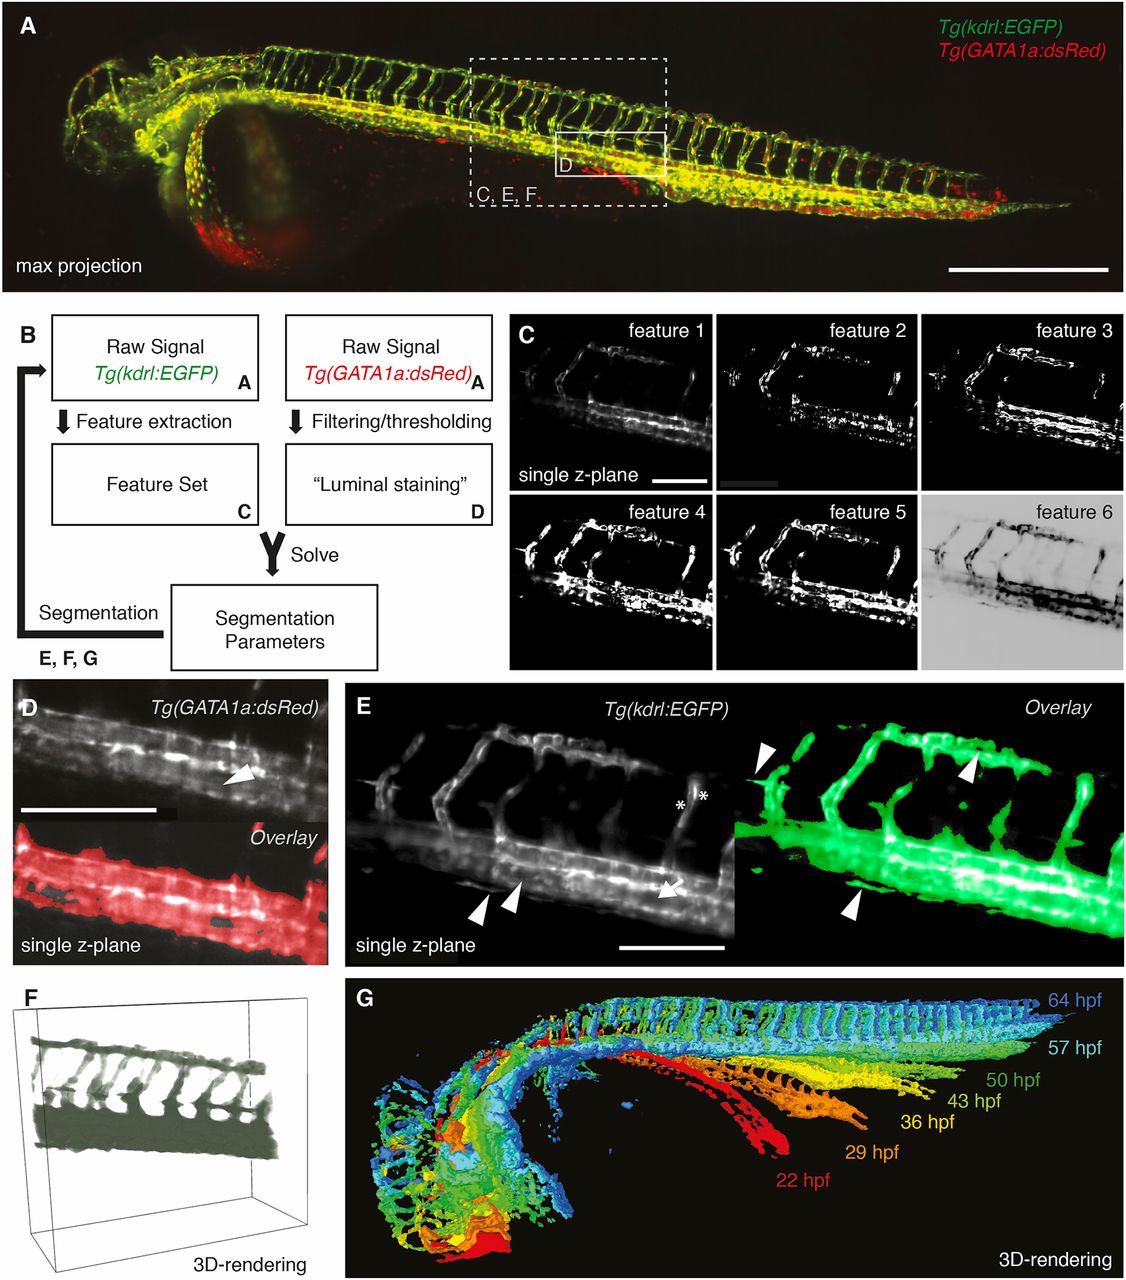
Fig. 2
Segmentation of the vascular data. (A) Maximum intensity projection of a zebrafish expressing the endothelial marker Tg(kdrl:EGFP) in green and the red blood cell marker Tg(GATA1a:dsRED) in red with boxes depicting selected regions shown in C-F. Scale bar: 500 µm. (B) Schematic of the segmentation process with references to the corresponding figure panels (A,C-G). For successful segmentation, the imagery data of two channels was required: the raw data of the vascular marker Tg(kdrl:EGFP) and of the red blood cell marker Tg(GATA1a:dsRed) (A). (C) From the vascular marker, a feature set (C) was extracted. By filtering and thresholding the images of the red blood cell marker, a proxy for a luminal staining was established. The weights for the different features (segmentation parameters) were then calculated by using the luminal proxy as ground truth in a machine learning-based approach. With the obtained feature weights, the segmentation of the vascular channel was achieved. Features extracted from the endothelial marker Tg(kdrl:EGFP) included the raw signal (feature 1), gradient x (feature 2), gradient y (feature 3), gradient z (feature 4), total gradient (feature 5) and the inverse gradient weighted raw image (feature 6). Scale bar: 150 µm. (D) Single plane of a 3D stack of the red blood cell marker Tg(GATA1a:dsRED) (top). As the red blood cells circulate in the vasculature, the interior of vessels was also filled with fluorescent signal (white arrowhead). Therefore, filtering and thresholding of the red blood cell marker raw signal (top) provided a ground truth (bottom, red) of signal inside the vasculature from which the segmentation parameters could be calculated. Scale bar: 150 µm. (E) Single plane of a 3D stack of the endothelial marker (left) highlighting the challenges of vascular segmentation: hollow tubes (arrow), intensity differences (asterisks) and small vessels next to a large vessel (arrowheads). Using our segmentation approach (right), even fine structures of the vasculature were segmented correctly (arrowheads). Scale bar: 150 µm. (F) 3D rendering of the selected region with the segmentation in green. (G) 3D rendering of the segmentations at different time points of development.