
|
Fig. S14
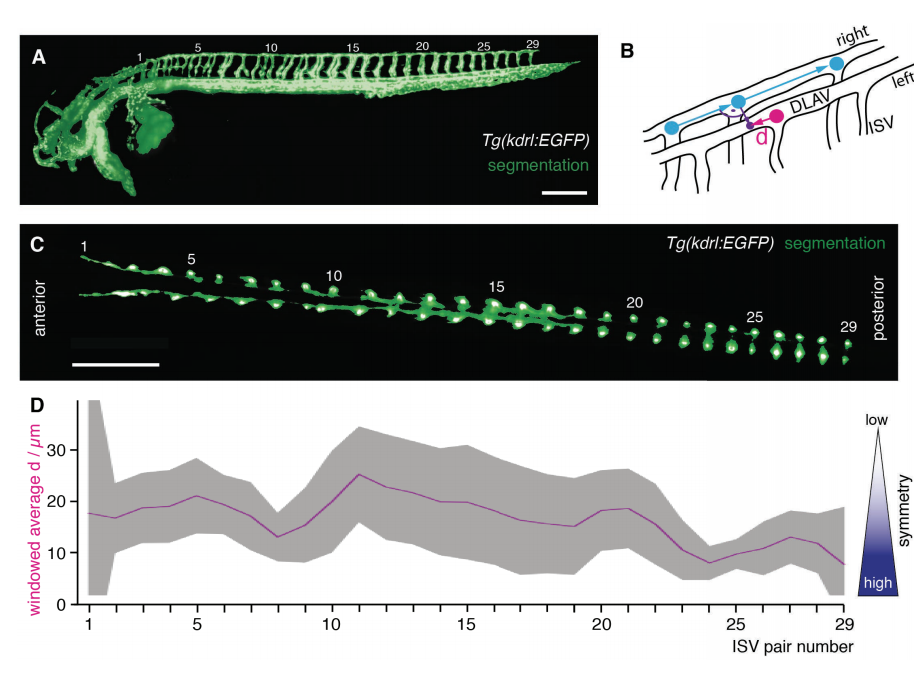
Quantification of symmetry of intersegmental vessel (ISV) pairs along the anterior-posterior axis at around 2.5 dpf
(A) 3D rendering of the raw signal of the vascular marker Tg(kdrl:EGFP) (gray) overlaid with the segmentation obtained by our novel segmentation approach (green). The ISV pairs along the anterior-posterior axis were numbered (1-29). Scale barP 0.25mm. (B) Schematic of the quantification of symmetry of ISV pairs. For each ISV of the right side (cyan circles) the corresponding closest ISV of the left side (magenta circle) was determined. The symmetry was measured as absolute value of the distance d of the intersection (purple circle) with the ISV position of the closest left ISV (magenta circle). The intersection (purple circle) was calculated as point where the vector originating at the right ISV position with an angle of 90 degrees to the right DLAV (purple vector) met. (C) Single slice from 3D stack imaged from the dorsal direction revealed the arrangement of the ISVs pairs numbered 1-29. In this slice, the raw signal of the vascular marker Tg(kdrl:EGF) (gray) was overlaid with the segmentation (green). Scale bar: 0.25 mm. (D) Result of the quantification of symmetry d from 3 fish. To decrease noise in the calculation, the value of the distance d was indicated as windowed average over the neighboring ISV pairs, i.e. n=9 (3 fish and 3 ISV pairs/data point) except for the ISV pair 1 and 29 where n=6 (3 fish, 2 ISV pairs). The average value was indicated as solid magenta line with the 95% confidence interval (t-statistics, n=9 [ISV pair 2-28], n=6 [ISV pair 1 and 29]) as a ribbon in gray.