
|
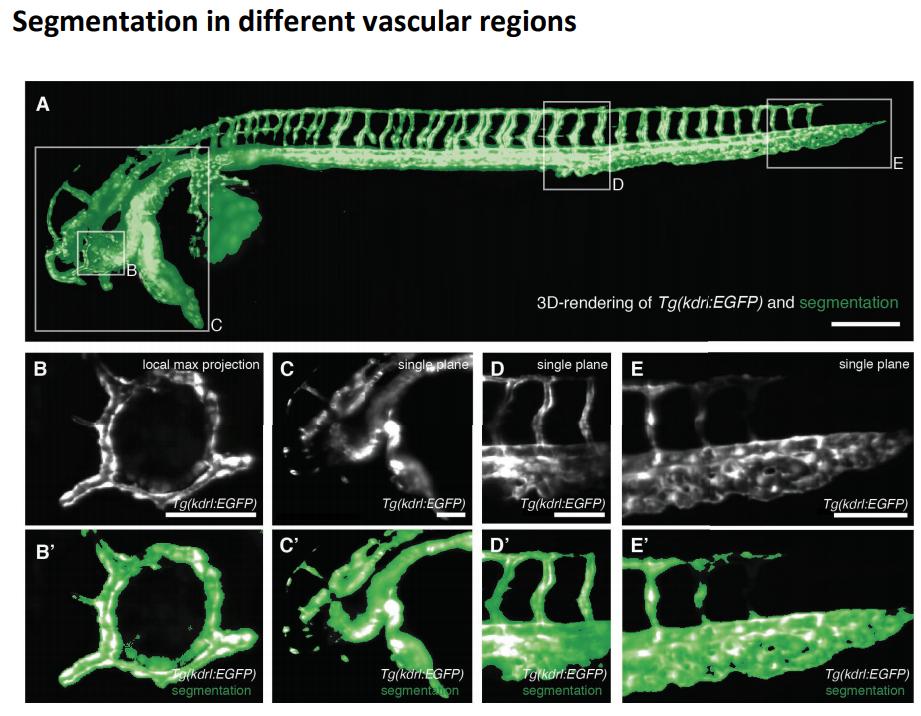
Fig. S9
Segmentation in different regions of the fish at around 2.5 dpf
(A) 3D rendering of the raw signa; of the vascular marker Tg(kdrl:EGFP) (gray) overlaid with the segmentation obtained by our novel segmentation approach (green) with boxes depicting selected regions shown in (B-E, B'-E'). Scale bar: 0.25 mm. (B, B') Vascular marker (top) and overlay with segmentation (botto) of a local maximum intensity projection over an 80 um deep 3D volume revealed the segmentation of the vasculature ring in the eye of zebrafish. Scale bar: 0.1 mm. (E, E') Vascular marker (top) and overlay with segmentation (bottom of a single plane from a 3D volume revealed the segmentation quality at the end of the tail of the zebrafish. Scale bar: 0.1 mm.