
|
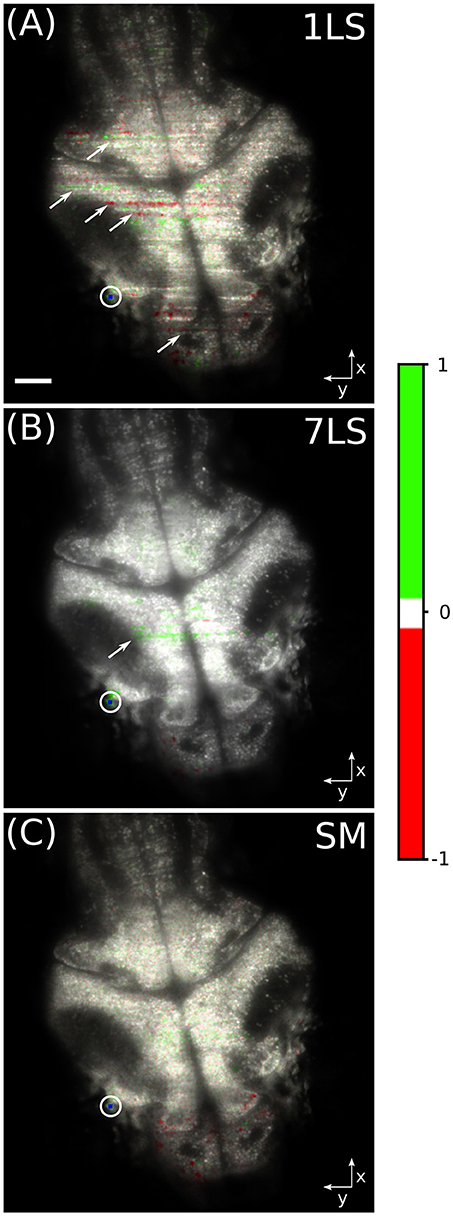
Fig. 4
HSV images of a fluorescent zebrafish larva brain, for a single static (A), seven static (B), and a dynamically swept (C) light-sheet illumination. The average fluorescence intensity is mapped on the value channel, while the saturation channel and the hue channel are a function of the Pearson correlation coefficient, as detailed by the color-bar. The temporal correlation was computed between the pixel visualized in blue inside the white circle and every other pixel in the dataset. Striping artifacts, like the ones indicated by arrows, can be mistaken for biological-like activation events in functional live-studies of neural activity. White scale bar of 50 μm.