
|
Fig. 2
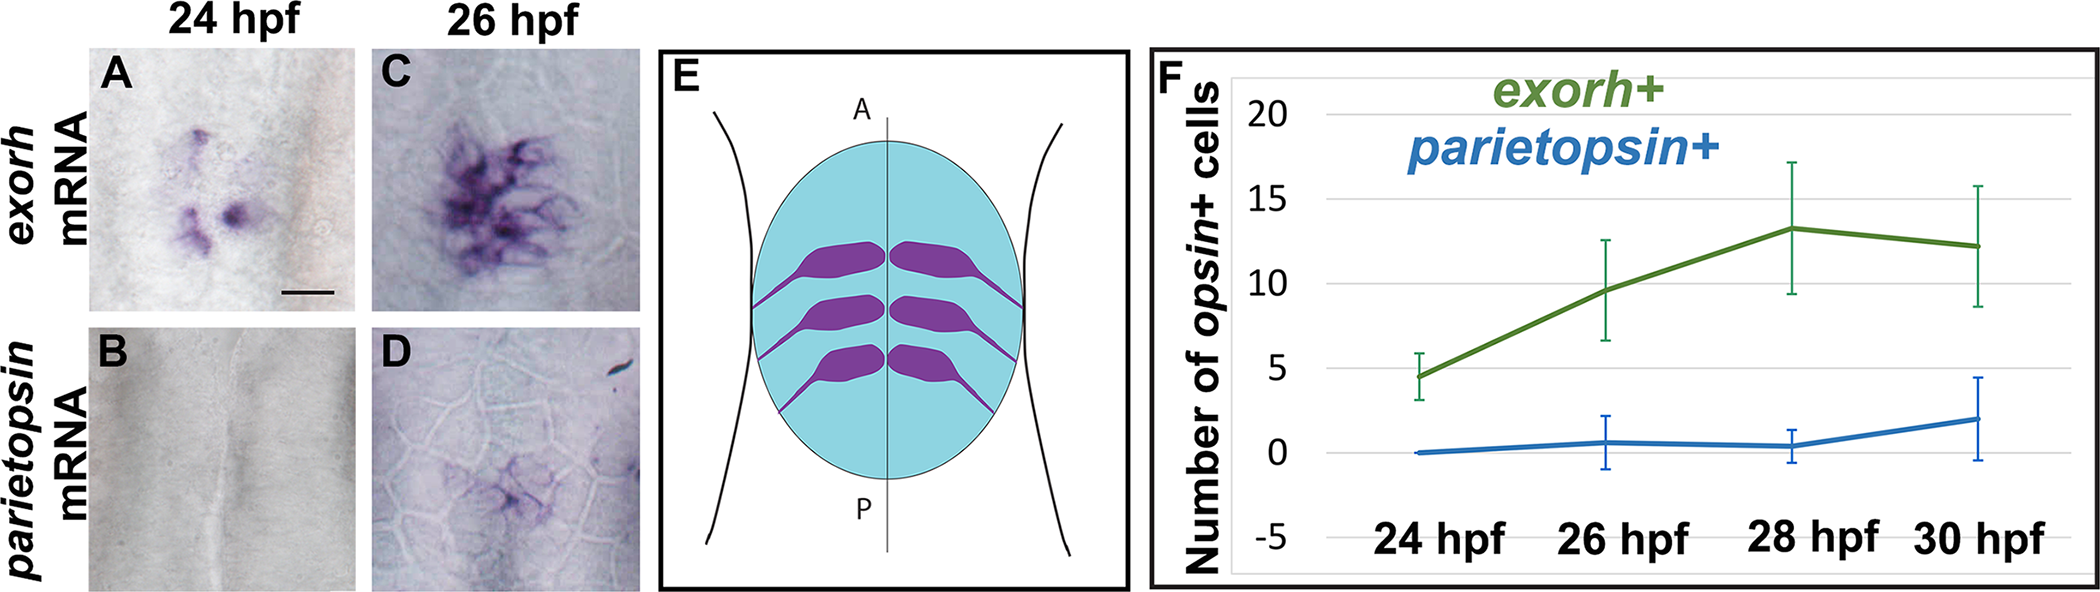
(A-D) In situ hybridization for exorh or parietopsin at 24 and 26 hpf. At 26 hpf, only 2 out of 10 embryos showed parietopsin+ cells; in these embryos, parietopsin expression is restricted to the center of the pineal territory. (E) Schematic representation showing the pineal territory in blue and nascent neurons in purple, indicating the orientation of the images in (A-D); dorsal view with the anterior to the top. (F) Counts of exorh+ and parietopsin+ cells in embryos of various stages, which are indicated on the x-axis. Error bars represent SD. Number of embryos analyzed are n = 6, 5, 11, and 5 for exorh+ cells at 24, 26, 28, and 30 hpf, respectively, and n = 10, 10, 21, and 5 for parietopsin+ cells at the same stages. Scale bar represents 15 μm. Underlying data can be found in S1 Data. exorh, exorhodopsin; hpf, hours post fertilization