
|
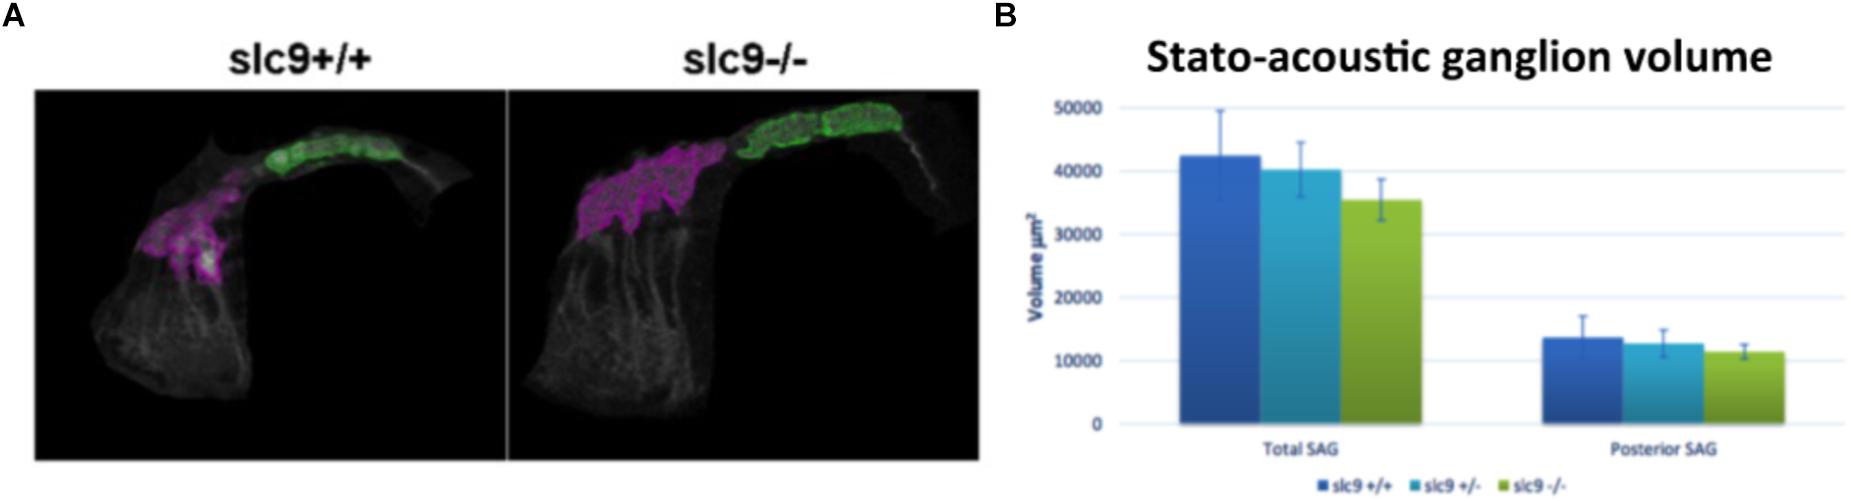
Fig. 7
Stato-acoustic ganglion (SAG) characterization. (A)3D reconstruction of the SAG in slc9a3r1 KI and their WT siblings (number of tested animals: slc9a3r1+/+ N = 3, slc9a3r1+/-N = 6, slc9a3r1R180Q/R180Q N = 6). The anterior part of the SAG is depicted in pink, while in green is indicated the posterior part which innervates the saccular macula and it is related to the auditory function. (B) The graph shows the total SAG volume (volume of the pink and green area) and the volume of the posterior SAG of slc9a3r1 animals. Although small differences (not statistically significant) no alterations were observed in the volume of the posterior stato-acoustic ganglion.