
Image
|
Figure Caption
Fig. 2
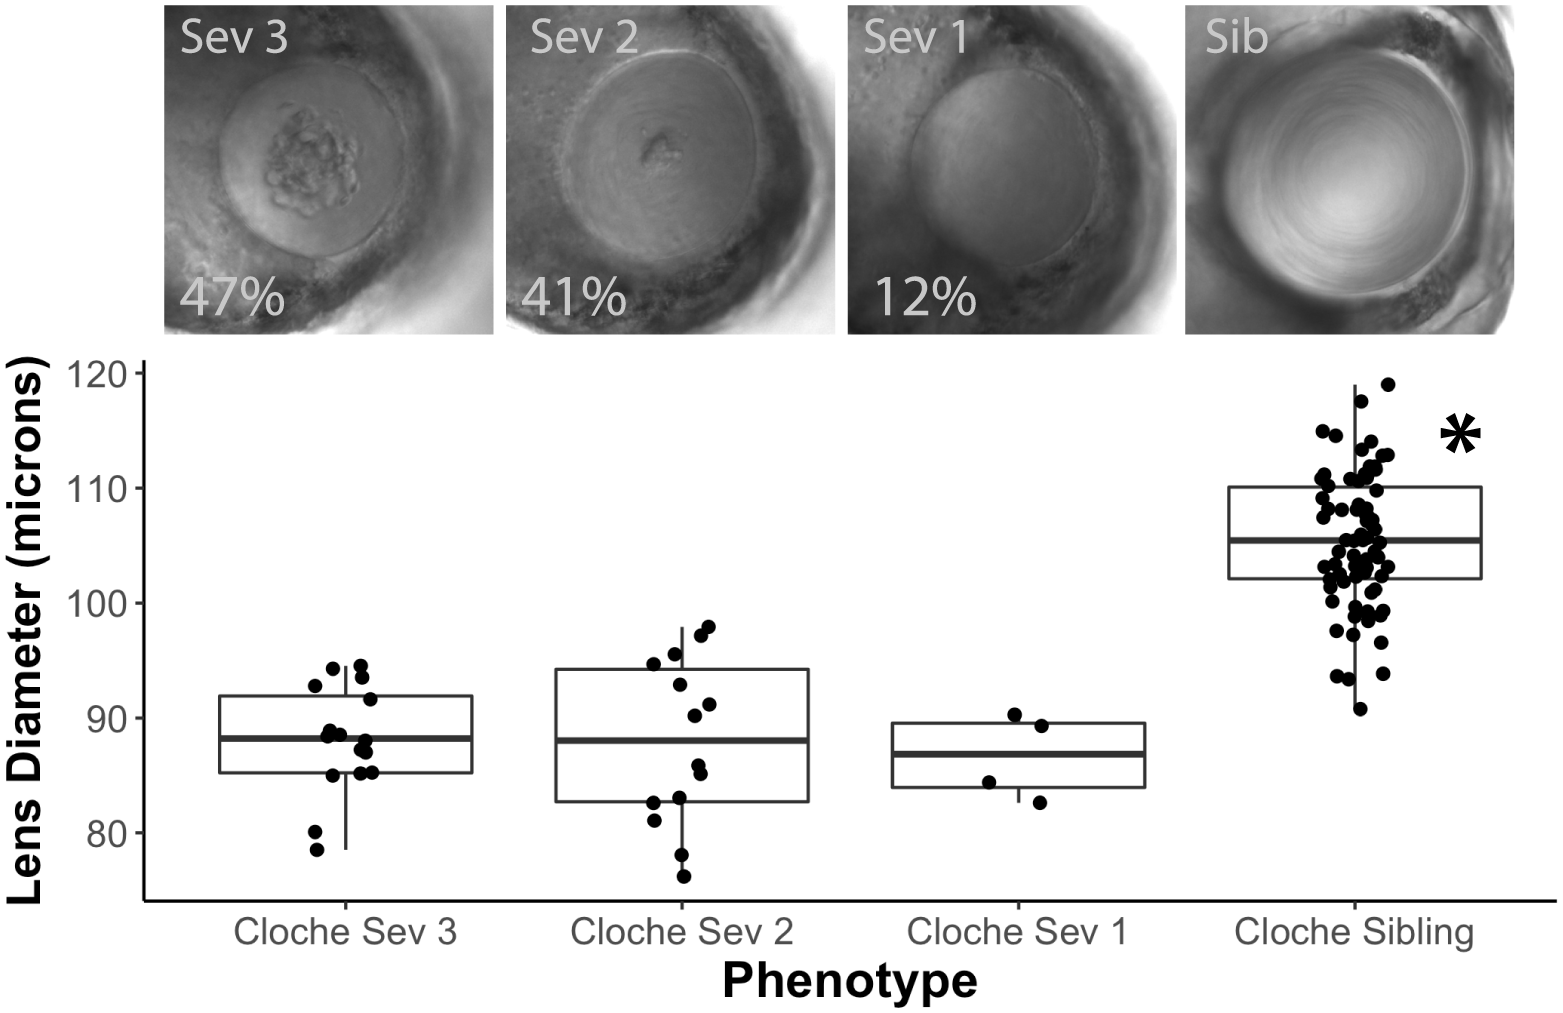
Severity of the cloche lens phenotype varies, but is not correlated with lens diameter.
Cloche embryos at 4 dpf were pooled into three severity groups. Representative lenses are shown for severity groups 3, 2, and 1, with group 3 being most severe. Percentages indicate the proportion of embryos with each severity (n = 34). A representative normal lens is shown from a cloche sibling. The lens diameter in cloche embryos was uniformly reduced in all severity groups compared to siblings (ANOVA p value < 0.0001; Tukey Honest Significant Difference (HSD) post test used to identify statistically significant mean for sibling group (*)).
Figure Data
Acknowledgments
This image is the copyrighted work of the attributed author or publisher, and
ZFIN has permission only to display this image to its users.
Additional permissions should be obtained from the applicable author or publisher of the image.
Full text @ PLoS One