
Fig. 3
|
Fig. 3
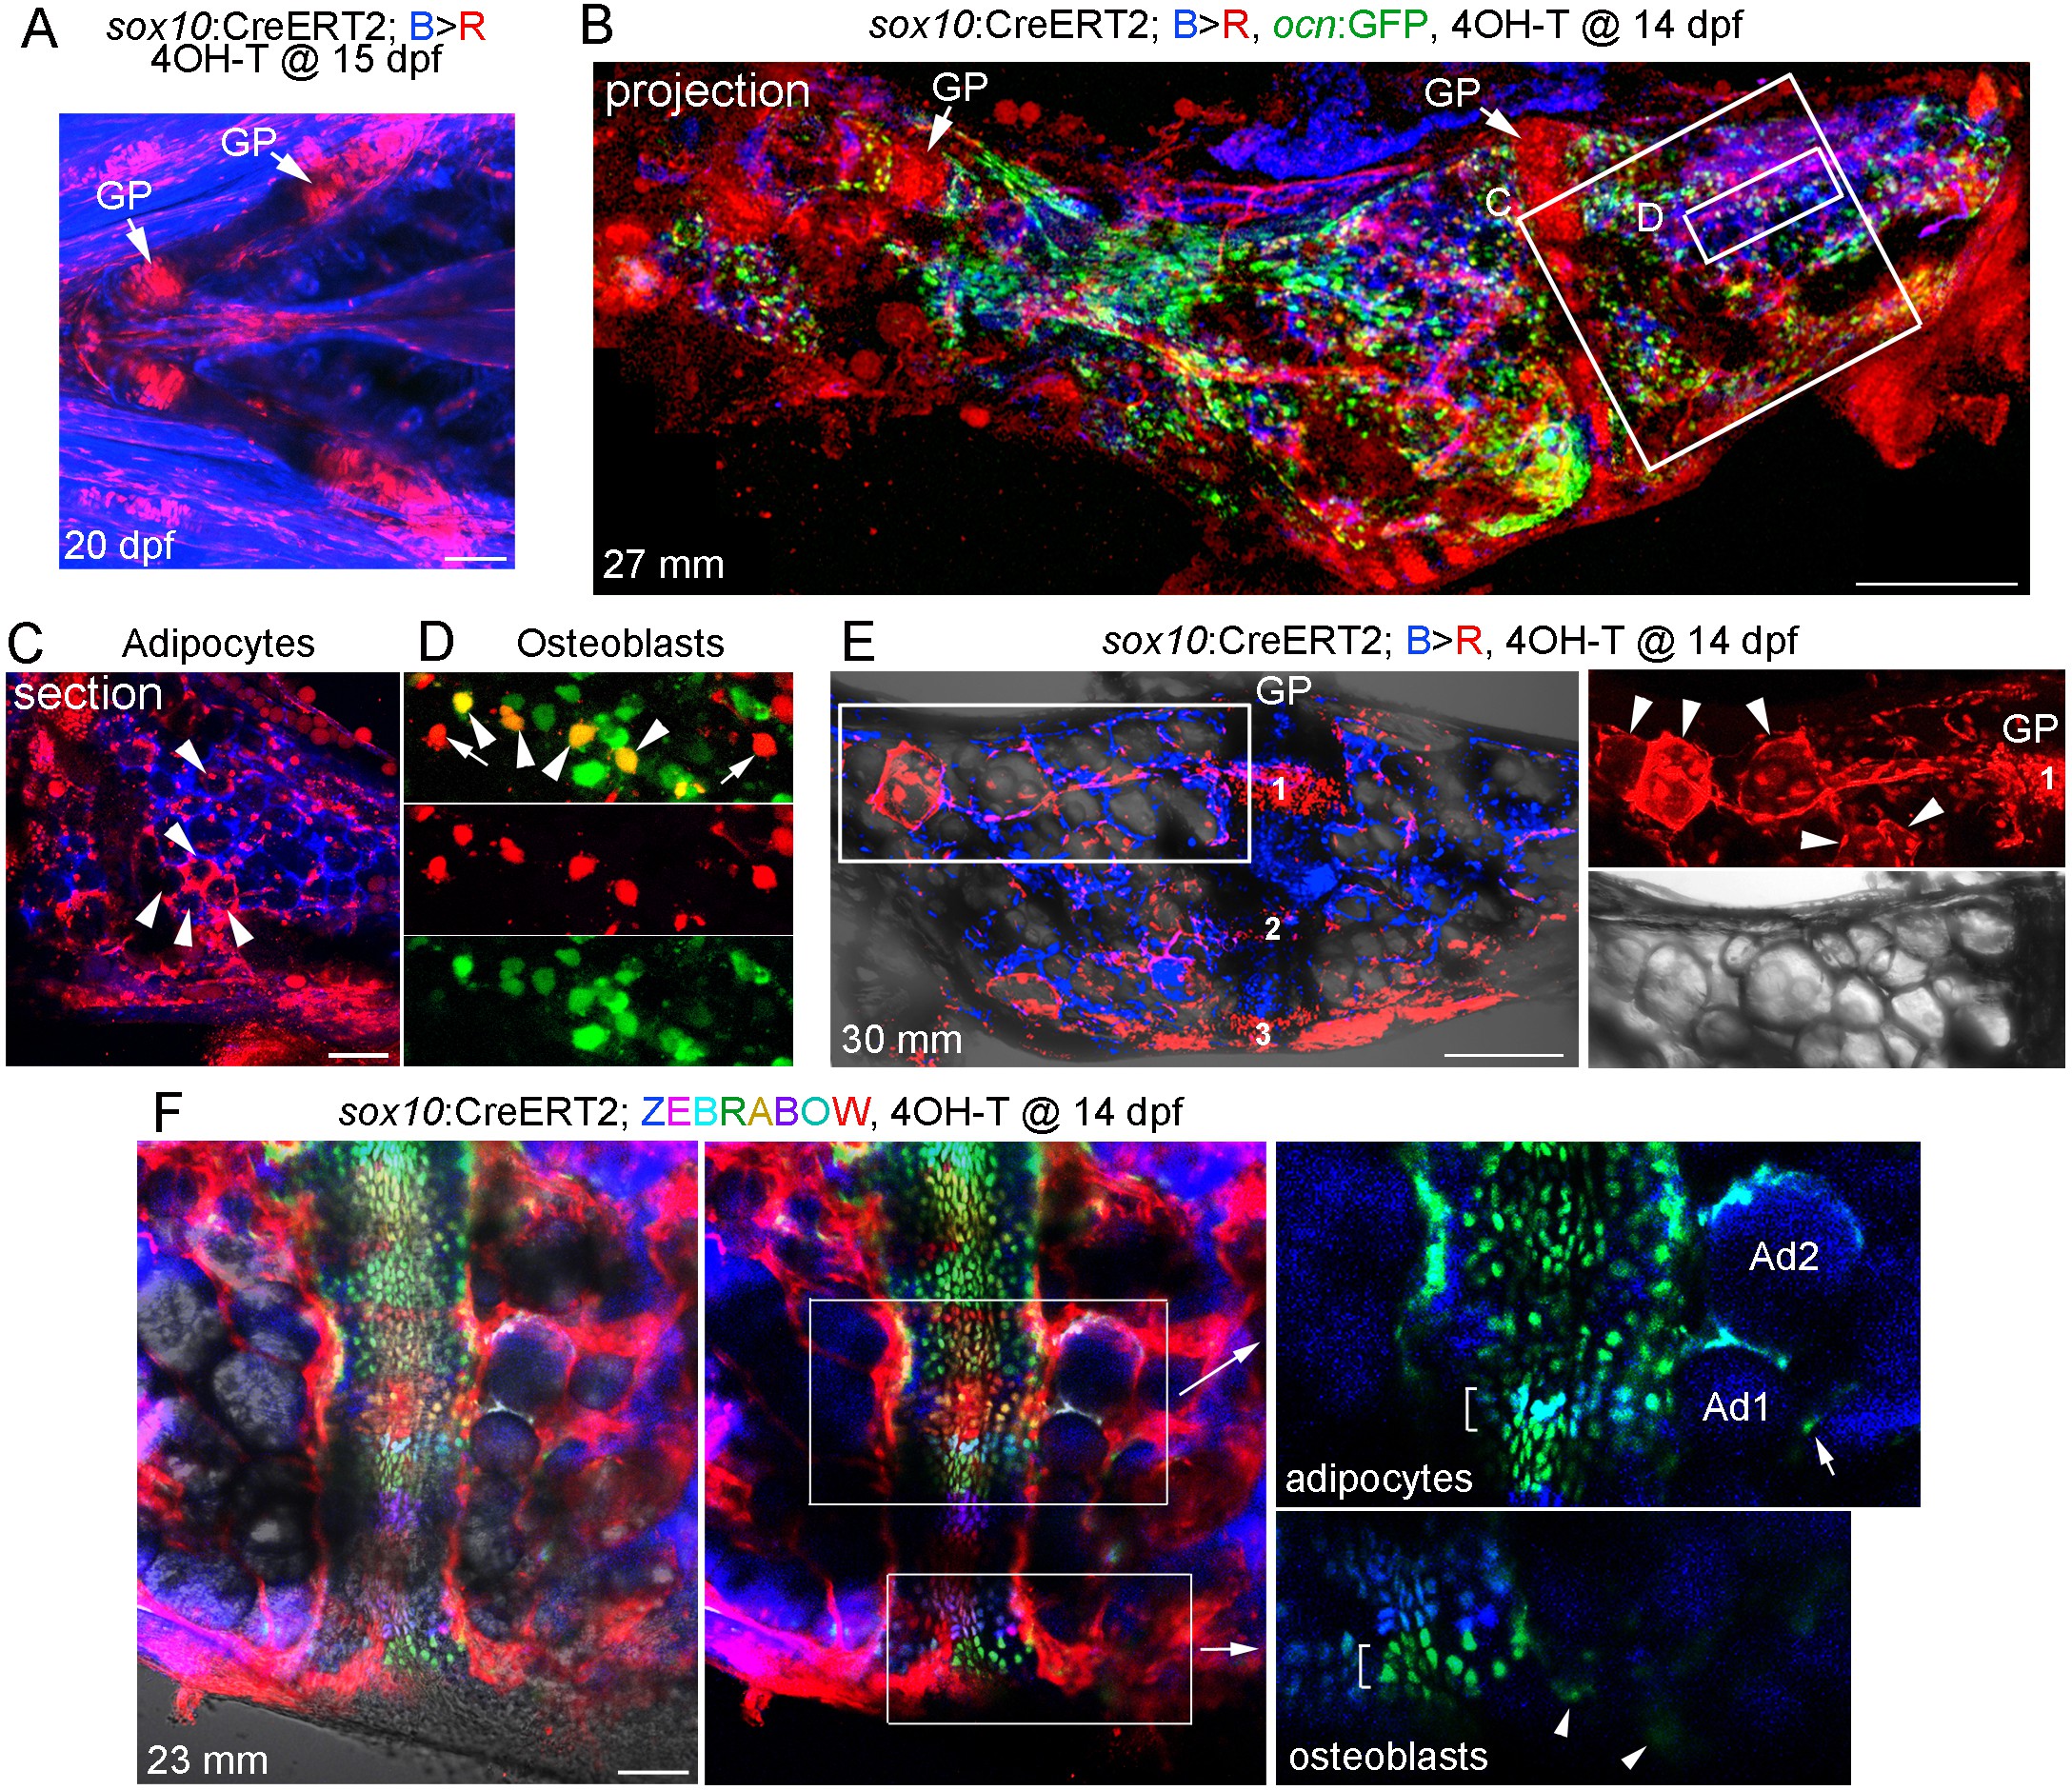
Contribution of sox10+ chondrocytes to osteoblasts and marrow adipocytes.
(A) Confocal projection of a sox10:CreERT2; bactin2:tagBFP>DsRed animal treated at 15 dpf with 4-OHT and imaged at 20 dpf. A ventral view of the lower face shows conversion in growth plate (GP) Ch chondrocytes, as well as additional mesenchymal cells throughout the face. n = 3. (B) Confocal projection of a dissected Ch bone from a sox10:CreERT2; bactin2:tagBFP>DsRed; ocn:GFP animal converted at 14 dpf and imaged as an adult (27 mm SL). In addition to labeling of the growth plates, extensive DsRed+ cells are seen throughout the Ch in 3/3 strongly converted animals. (C) Higher magnification confocal section through the boxed region in (B) shows a subset of adipocytes labeled by DsRed (red, arrowheads). (D) Higher magnification confocal section through the boxed region in (B) shows a mixture of converted (yellow, arrowheads) and unconverted (green) ocn:GFP + osteoblasts, as well as converted ocn:GFP- mesenchymal cells (red, arrows). (E) Confocal projection of a dissected Ch bone from a sox10:CreERT2; bactin2:tagBFP >DsRed animal converted at 14 dpf and imaged as an adult (30 mm SL). Three prominent clones in the growth plate are numbered. In the boxed regions to the right, a discrete clone of growth plate chondrocytes transitions into a stream of mesenchymal cells and then a number of adipocytes (arrowheads). The brightfield image from the same sample (below) shows the lipid vesicles characteristic of adipocytes. Similar clonal contributions were seen in four independently converted animals. (F) Confocal projection of a portion of a dissected Ch growth plate from a sox10:CreERT2; Zebrabow animal converted at 14 dpf and imaged as an adult (23 mm SL). Images are shown with and without the Nomarski channel. Unconverted cells are red, and distinctly colored growth plate clones are visible. Magnified images corresponding to the boxed regions are shown without the red channel to highlight distinct green and teal clones (brackets). The teal clone of growth plate chondrocytes is contiguous with two similarly colored adipocytes (Ad1, Ad2), and the green clone is contiguous with faintly green cells (arrowheads) in cortical bone. In the adipocyte clone, the arrow indicates a green marrow cell distinct from the teal-colored adipocytes. Comparable clonal contributions were seen in three independently converted animals. Scale bars = 100 μm (A), 200 μm (B,E,F), 50 μm (C).