
Image
|
Figure Caption
Fig. S4AR
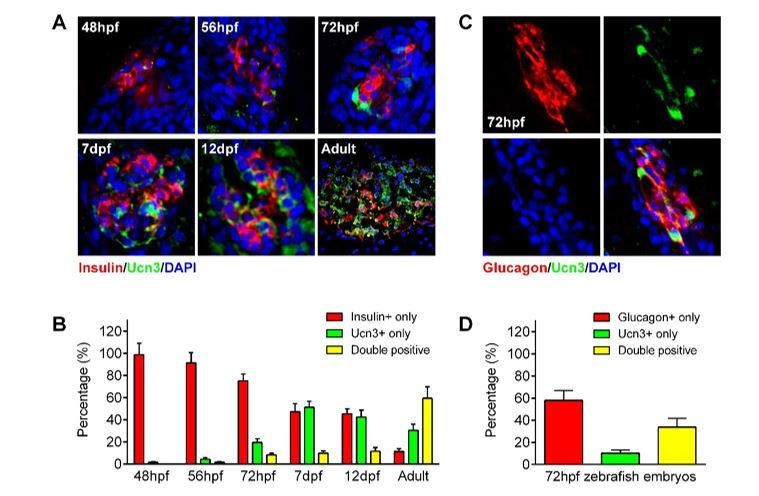
ucn3 expression pattern in zebrafish islets at different developmental stages.
(A) Immunofluorescent labelling of insulin and ucn3 in zebrafish islets at indicated stages. (B) Quantification of ucn3-positive β-cells in zebrafish islets at the indicated stages in A. n = 6-12 islets per condition. (C) Immunofluorescent labelling of glucagon and ucn3 in zebrafish islets at 72 hpf. (D) Quantification of ucn3-positive α-cells in zebrafish islets at 72 hpf. n = 10 embryos.
Acknowledgments
This image is the copyrighted work of the attributed author or publisher, and
ZFIN has permission only to display this image to its users.
Additional permissions should be obtained from the applicable author or publisher of the image.
Full text @ Elife