
|
Fig. 2-S1
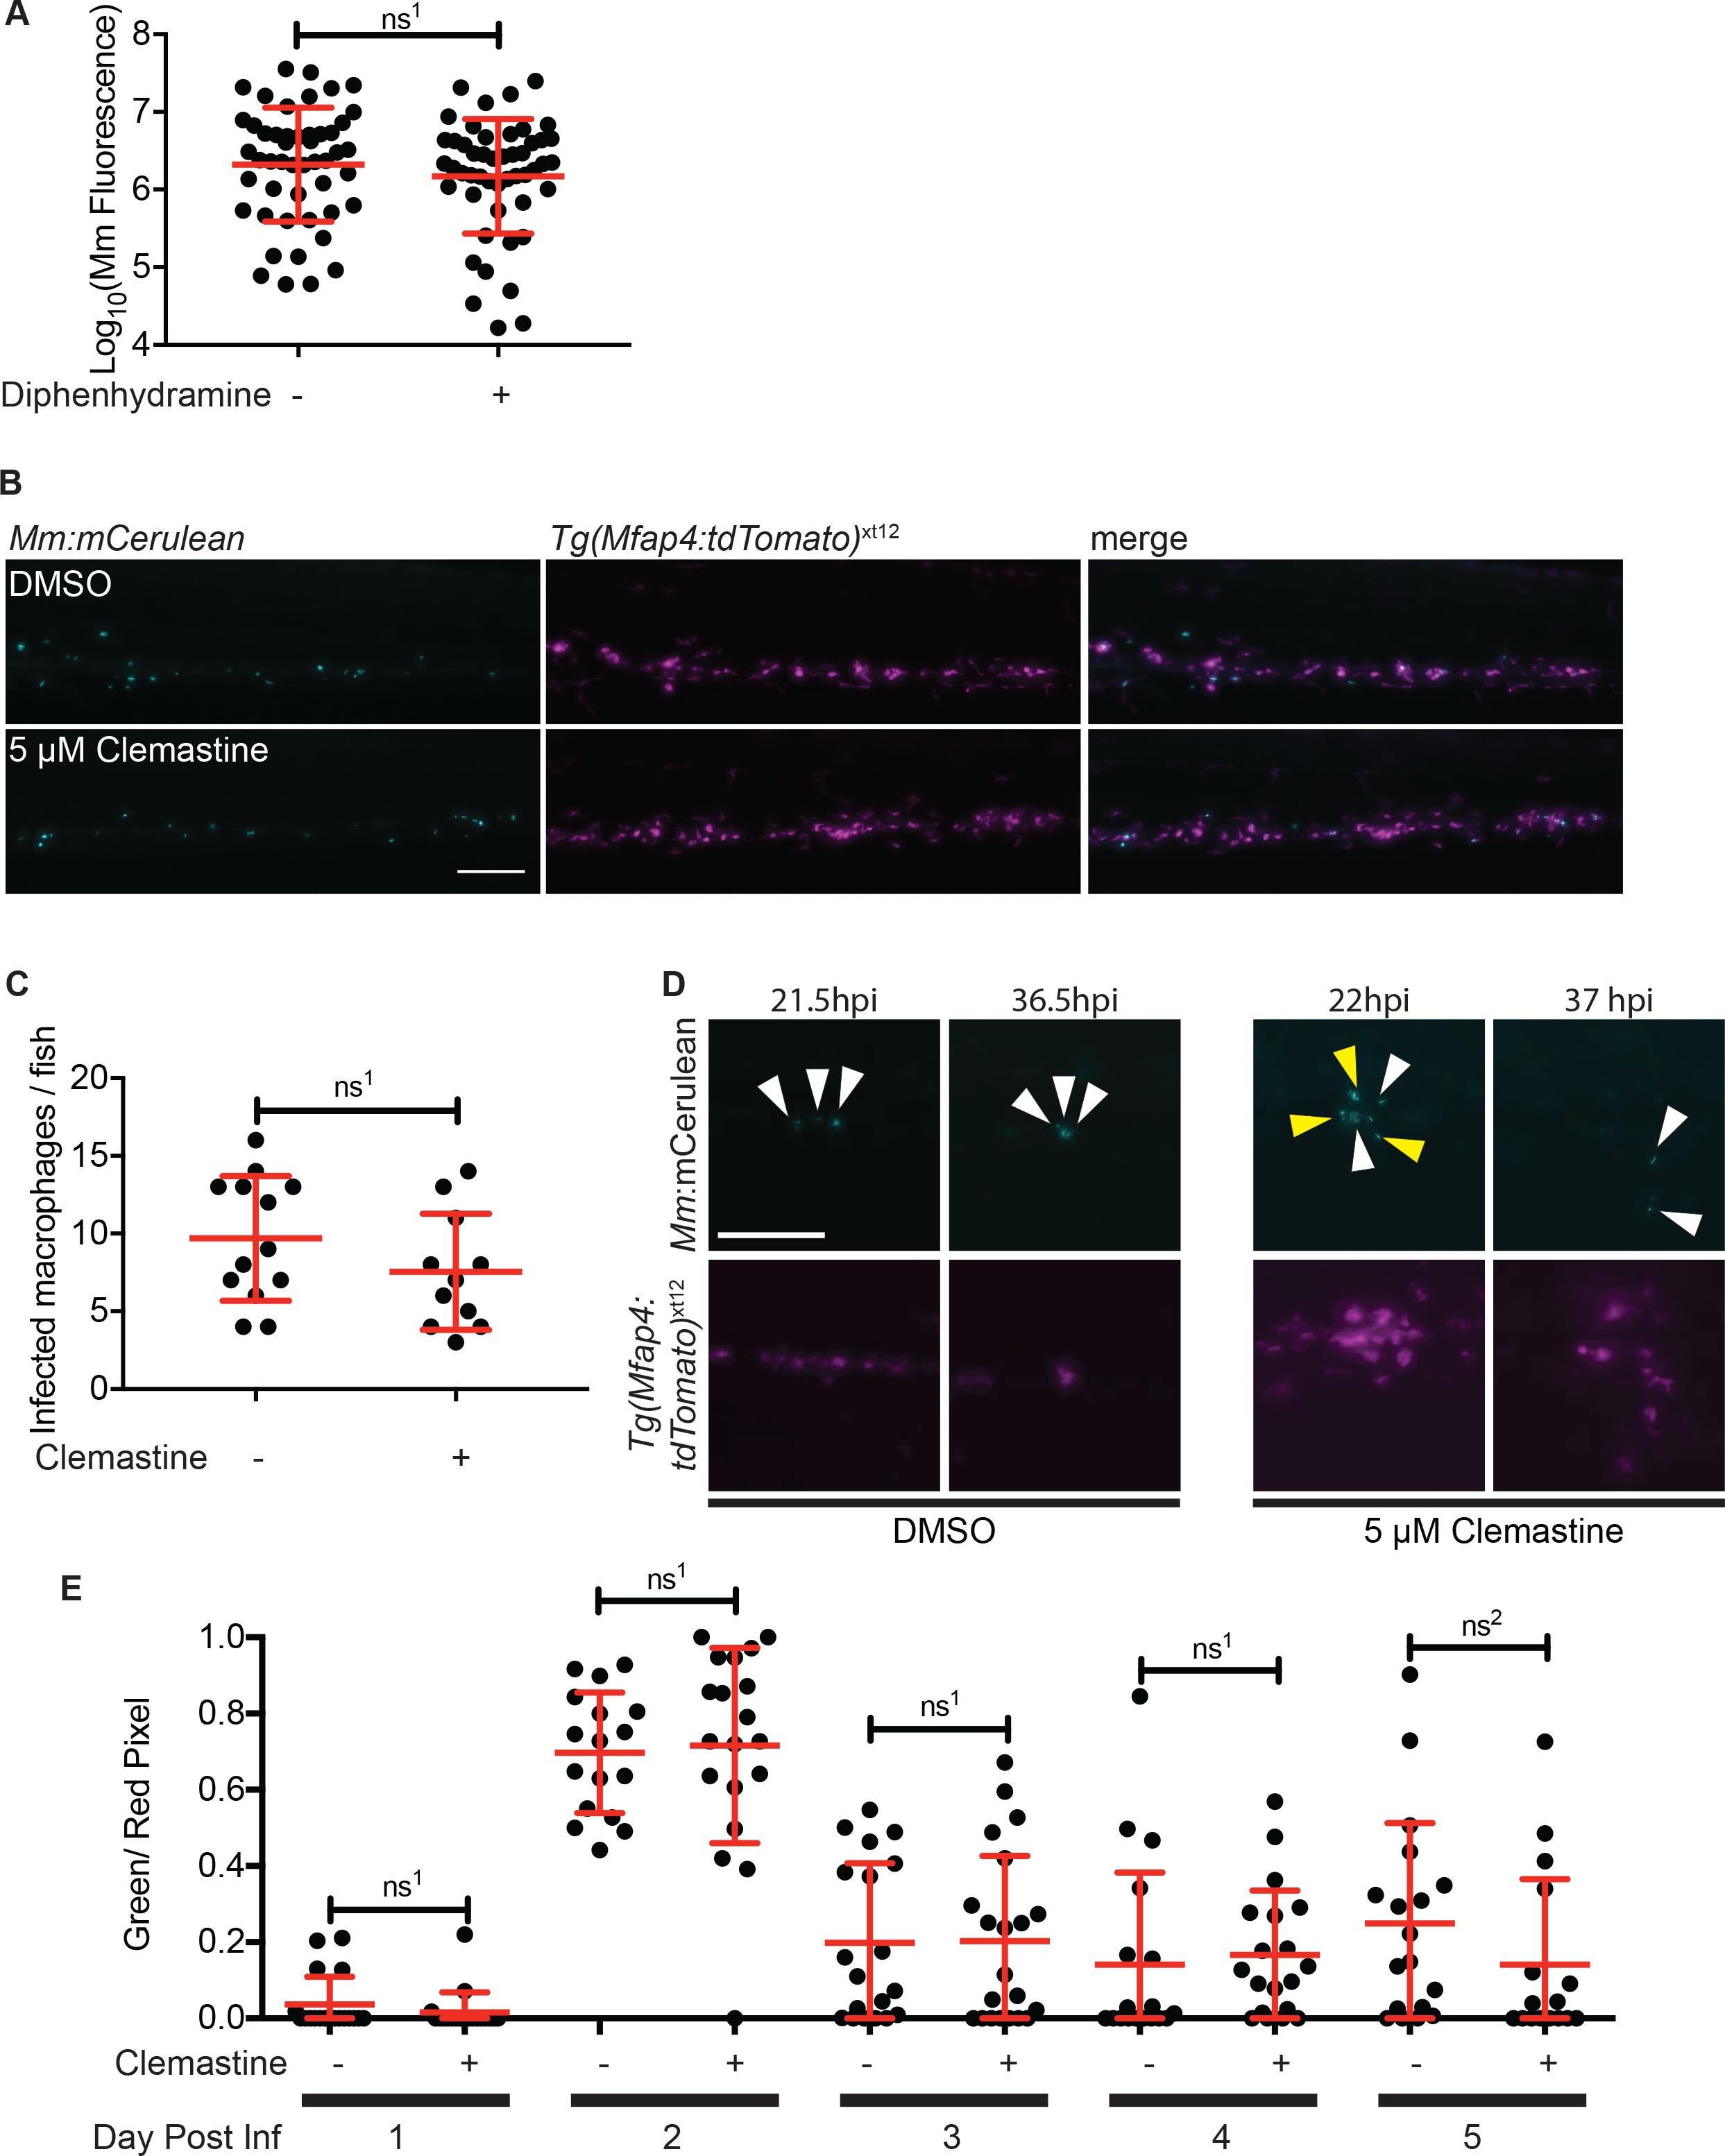
Macrophage function during clemastine treatment.
(A) Bacterial burden per animal assessed by Mm:tdTomato fluorescence 5 days post-infection after treatment with 0.5% DMSO or 5 µM diphenhydramine. (B) Example images from quantification in Figure 2G. Bacteria are Mm:mCerulean and macrophages Tg(mfap4:tdTomato)xt12 are false colored in magenta, maximum intensity projection of 5 z stacks of 10 µm. Scale bar is 100 µm. (C) Number of infected macrophages per fish. Each dot represents the total number of infected macrophages in each animal from experiment in Figure 2G. (D) Stills from Video 1. Scale bar is 100 µm. Maximum intensity projection of 4 z-stacks of 15 µm. White arrows mark bacteria that are present in both initial and final timeframes, and yellow arrows mark individual bacteria that disappear during the timelapse. (E) Ratio of green to red fluorescent bacteria from Mm:aprA’::GFP,smyc::mCherry infection (~ 50 CFU) in wildtype zebrafish larvae over the course of a 5-day infection during treatment with 0.5% DMSO or 5 µM clemastine. (A) Unpaired t-test, ns1 = 0.3147, error bars are s.d. (C) Unpaired t-test, ns1 = 0.1907, error bars are s.d. (E) Unpaired t-tests between treatments for each day, ns1 > 0.9999, ns2 = 0.5505, error bars are s.d. p-Values from all transformed and untransformed data are provided in Supplementary file 3.