
Image
|
Figure Caption
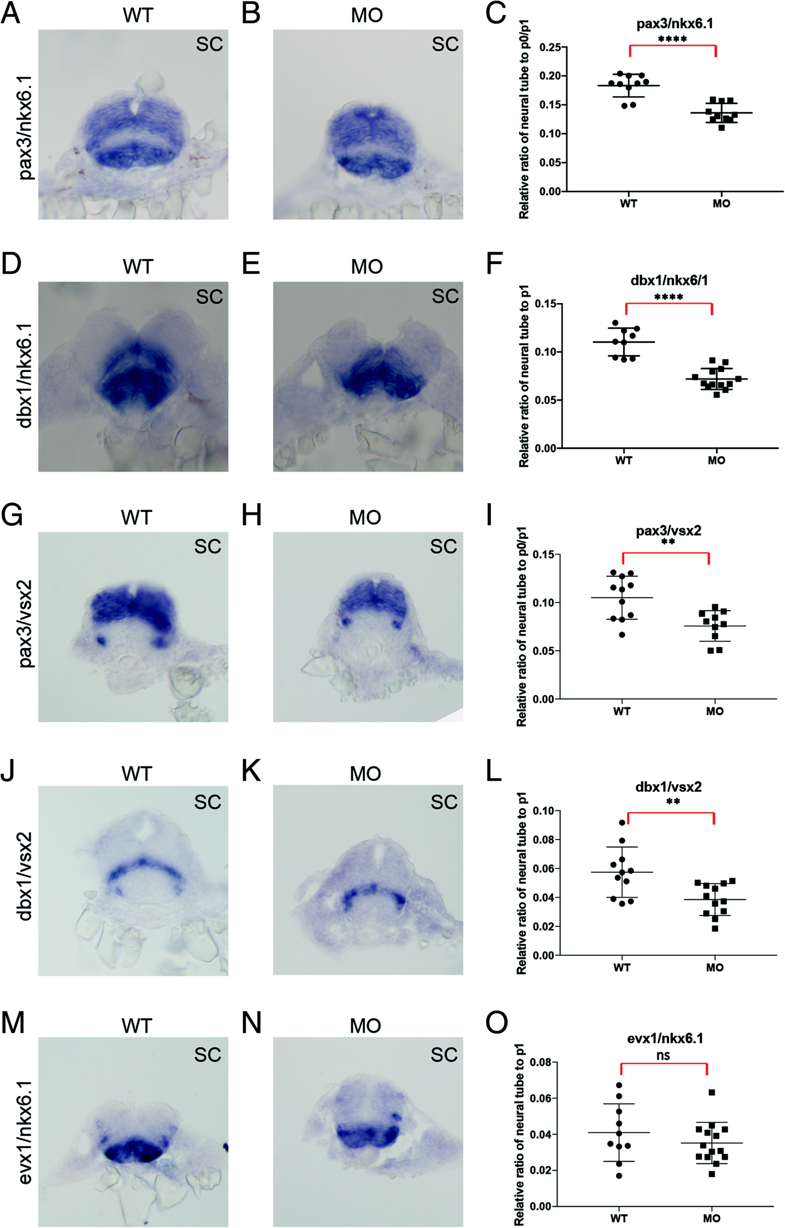
Fig. 8
prdm12b controls the size of the p1 domain. Expression of pax3/nkx6.1 (a, b), dbx1/nkx6.1 (d, e), pax3/vsx2 (g, h), dbx1/vsx2 (j, k) and evx1/nkx6.1 (m, n) in 24hpf wildtype (a, d, g, j, m) or prdm12b MO-injected (b, e, h, k, n) embryos. Panels show cross sections through the spinal cord with dorsal to the top. c, f, i, l, o show quantification of the size (along the dorsoventral axis) of the p0/p1 domain (c, i) or the p1 domain (f, l, o) relative to the neural tube. At least 10 representative sections were used for each gene pair
Figure Data
Acknowledgments
This image is the copyrighted work of the attributed author or publisher, and
ZFIN has permission only to display this image to its users.
Additional permissions should be obtained from the applicable author or publisher of the image.
Full text @ Neural Dev.