
Image
|
Figure Caption
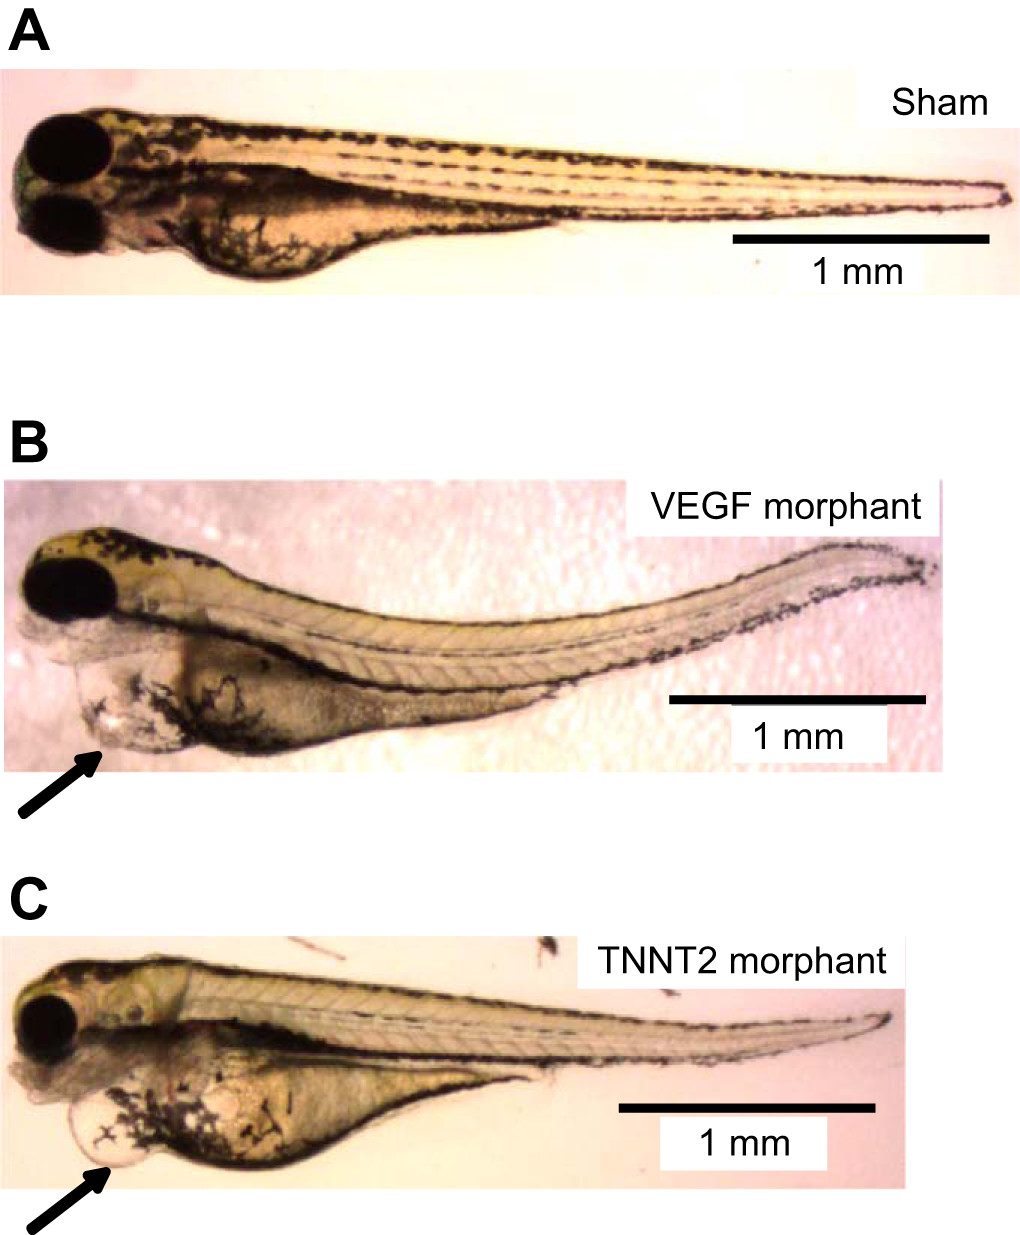
Fig. 2
Representative microscopy images of sham (A), VEGF morphant (B), and cardiac troponin T (TNNT2; C) morphant zebrafish larvae at 4 days postfertilization (dpf). Black arrows indicate pericardial edema; scale bars represent 1 mm.
Acknowledgments
This image is the copyrighted work of the attributed author or publisher, and
ZFIN has permission only to display this image to its users.
Additional permissions should be obtained from the applicable author or publisher of the image.
Full text @ Am. J. Physiol. Regul. Integr. Comp. Physiol.