
|
Fig. 1
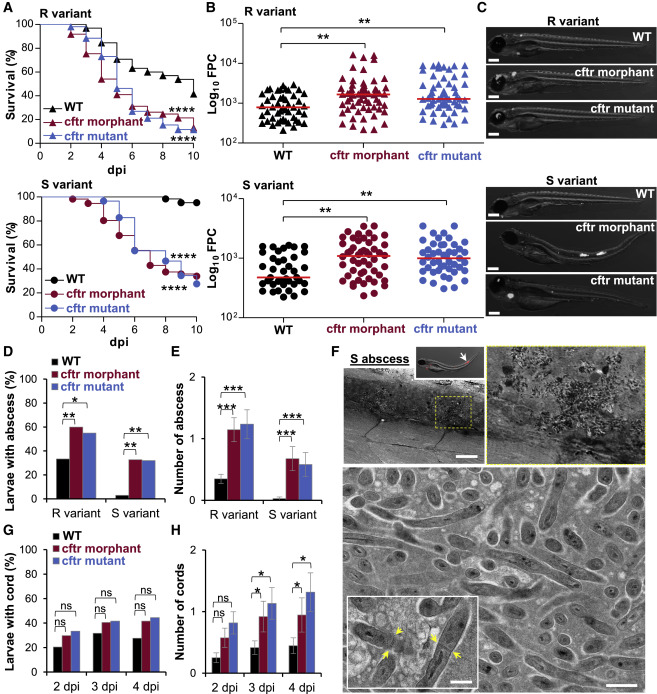
cftr Deficiency Increases Susceptibility to M. abscessus Infection
(A–H) WT, cftr mutant, and cftr morphant were intravenously (i.v.) infected with either Mabs R or S expressing tdTomato.
(A) Survival analysis of R-infected (top) or S-infected (bottom) larvae. Data are plotted as percentage of surviving animals over 10 days (n = 60, three experiments).
(B) Mean bacterial loads as fluorescence pixel counts (FPCs; average of three independent experiments) of 3 dpi larvae infected by either Mabs R (top) or S (bottom).
(C) Representative overlay fluorescence microscopy images of Mabs R-infected (top) or S-infected (bottom) larvae at 3 dpi. Scale bars, 200 μm.
(D and E) Percentage of 3 dpi larvae with abscess (D) and associated mean ± SEM number of abscess per infected animal (E) (n = 45, three experiments).
(F) EM showing a sagittal section through a Mabs S abscess in a cftrmorphant. Overview image of the abscess into the spinal cord (top; scale bar, 25 μm). Representative EM image of the abscess lesion with many extracellular bacterial in an area of acellular necrotic debris (bottom; scale bar, 0.5 μm). Closeup showing bacterial division, with yellow arrows indicating septum of division (scale bar, 0.5 μm).
(G and H) Kinetic of Mabs R cording in whole embryos over 4 days of infection (G) and associated mean ± SEM number of cords per infected animal (H) (n = 45, three experiments).