
|
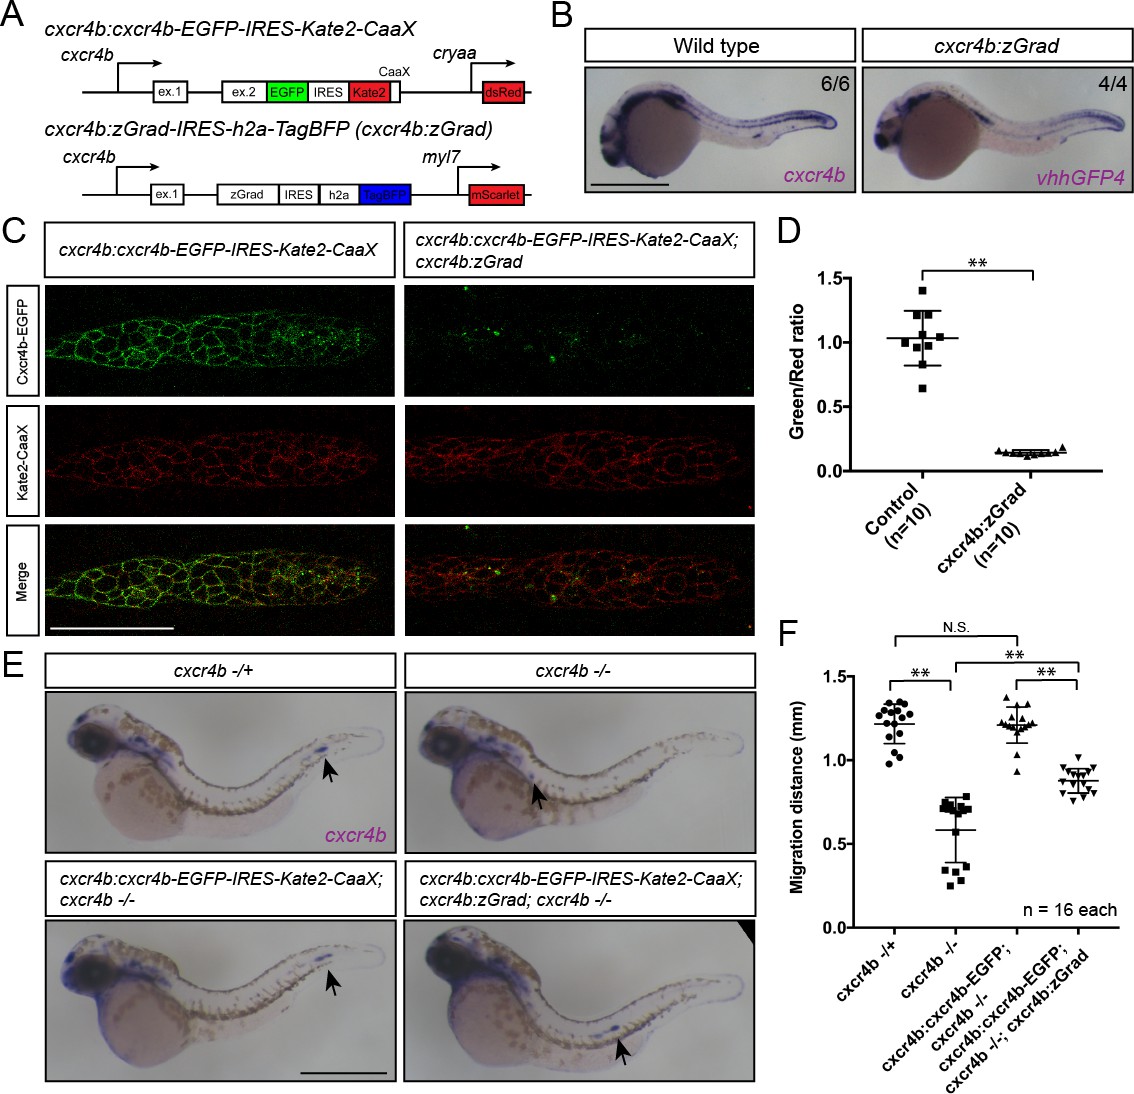
Fig. 6
Tissue-specific expression of zGrad in the primordium degrades Cxcr4b-EGFP and slows down primordium migration.
(A) Schematic of strategy to assess zGrad-mediated Cxcr4b-EGFP degradation in the primordium on primordium migration. (B) In situ hybridization against cxcr4b mRNA in a wildtype embryo and against zGrad mRNA in a cxcr4b:zGrad embryo at 24hpf. Scale bar: 0.5 mm. (C) Single-plane confocal images of the primordium in cxcr4b:cxcr4b-EGFP-IRES-Kate2-CaaX-p1 control (left) and cxcr4b:cxcr4b-EGFP-IRES-Kate2-CaaX-p1; cxcr4b:zGrad embryos (right) at 36 hpf. Note that the embryos are cxcr4b +/- or cxcr4b -/-. Scale bar: 50 µm. (D) Quantification of Cxcr4b-EGFP to Kate2-CaaX fluorescence intensity ratio in the primordia of control embryos (blue) and embryos expressing zGrad in the primordium at 36 hpf. Mean and SD are indicated. **=p < 0.01. (E) In situ hybridization against cxcr4b mRNA in cxcr4b-/+ (top left), cxcr4b-/- (top right), cxcr4b:cxcr4b-EGFP-IRES-Kate2-CaaX-p1; cxcr4b-/- (bottom left) and cxcr4b:cxcr4b-EGFP-IRES-Kate2-CaaX-p1; cxcr4b-/-; cxcr4b:zGrad embryos (bottom right) at 38 hpf. Arrows indicate the location of the primordium. Scale bar: 0.5 mm. (F) Quantification of primordia migration distance of the indicated genotypes at 38 hpf. Mean, SD and n are indicated. **=p < 0.01, N.S. = p > 0.05