
Image
|
Figure Caption
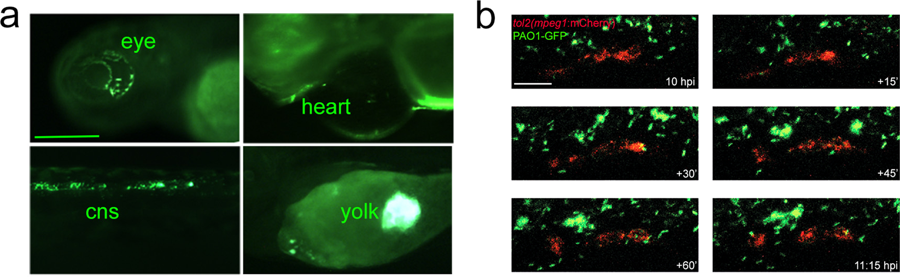
Fig. 1
Infection of zebrafish embryos with PAO1. (a) PAO1-GFP injected bacteria were visualized in different districts of the embryo at 20 hpi. Cns: central nervous system. Scale bar indicates 100 μm. (b) Injection of the tol2(mpeg1:mcherry) plasmid allowed the visualization of red macrophages migrating towards green PAO-GFP bacteria. Starting from 10 hpi, different images of the same region of the trunk were taken every 15 minutes. Scale bar indicates 20 μm.
Acknowledgments
This image is the copyrighted work of the attributed author or publisher, and
ZFIN has permission only to display this image to its users.
Additional permissions should be obtained from the applicable author or publisher of the image.
Full text @ Sci. Rep.