
|
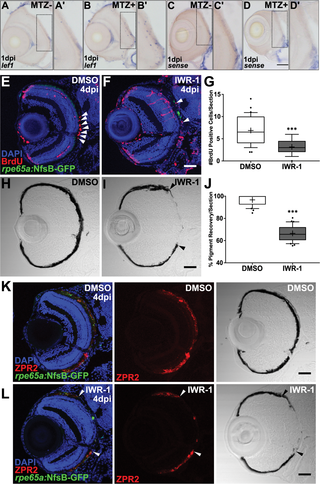
Fig. 13
(A-D) Transverse sections of lef1 or sense RNA expression in unablated 6dpf (MTZ-) and ablated 1dpi (MTZ+) larvae. lef1 is detected in and around the RPE in MTZ+ (B’) but not MTZ- larvae (A’). lef1: n>5; lef1 sense: n = 4. (E-J) Transverse sections of 4dpi ablated DMSO- (E,H; n = 10) and 15μM IWR-1-treated (F,I; n = 11) larvae exposed to a 24-hour pulse of BrdU from 3-4dpi. (E,F) Green = eGFP, blue = DNA, red = BrdU; white arrowheads highlight BrdU+ cells in the RPE. (G) Quantification of BrdU+ cells/section reveals that IWR-1 treatment significantly decreases the number of proliferative cells in the RPE at 4dpi (Student’s unpaired t-test, *** p<0.0001). Brightfield images (H,I) and quantification of percent RPE recovery/section (J) shows a significant delay in recovery of a pigmented monolayer in IWR-1 treated larvae (Student’s unpaired t-test, *** p<0.0001). (I) Black arrowheads indicate the central-most edge of the regenerating RPE. Transverse sections of 4dpi ablated DMSO- (K; n = 6) and 15μM IWR-1-treated (L; n = 5) larvae stained for ZPR2 (red). Green = eGFP and blue = nuclei. ZPR2 staining overlaps with a thick, heavily pigmented regenerated RPE monolayer. (L) Arrowheadsindicate the central-most edge of the regenerating RPE. In IWR-1-treated larvae, ZPR2 staining is not observed central of the rim of pigment indicating a lapse in RPE regeneration, not a pigmentation deficiency. Dorsal is up and distal is left. Scale bars = 40μm.