
|
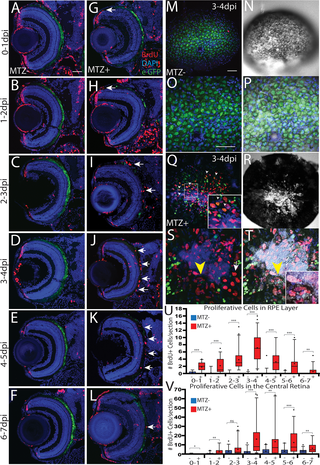
Fig. 10
(A-L) Transverse retinal sections of unablated (A-F) and ablated (G-L) larvae exposed to 24-hour BrdU pulses at various days post-injury. BrdU+ cells first appear in the periphery as early as 0-1dpi (arrow, G), and 1-2dpi (arrow, H). As regeneration proceeds, BrdU+cells appear closer to the central injury site and at the inner tip of the regenerating RPE layer (arrows, I). BrdU+ cells then populate the injury site (arrows, J-L). (M-T) en facewholemount images of unablated (M-P) and ablated (Q-T) eyes from larvae exposed to BrdU between 3-4dpi. White arrowheads in (Q) and (Q, inset) indicate BrdU+/eGFP+cells near the injury site. Yellow arrowhead in (S) and (T) indicate BrdU+ cells proximal to the injury site that are beginning to become pigmented. (Inset, T) Magnified image of BrdU+, pigmented cells. (U) Quantification of total number of BrdU+ cells/section in the RPE (U) and central retina (V) reveals an increase of BrdU+ cells in the RPE starting at 0-1dpi and peaking at 3-4dpi. Proliferation in the central retina significantly increased at 3-4dpi. Mann-Whitney U Test, * p<0.05, ** p<0.005, *** p<0.0005. Dorsal is up and distal is left. Scale bar = 40μm.