
|
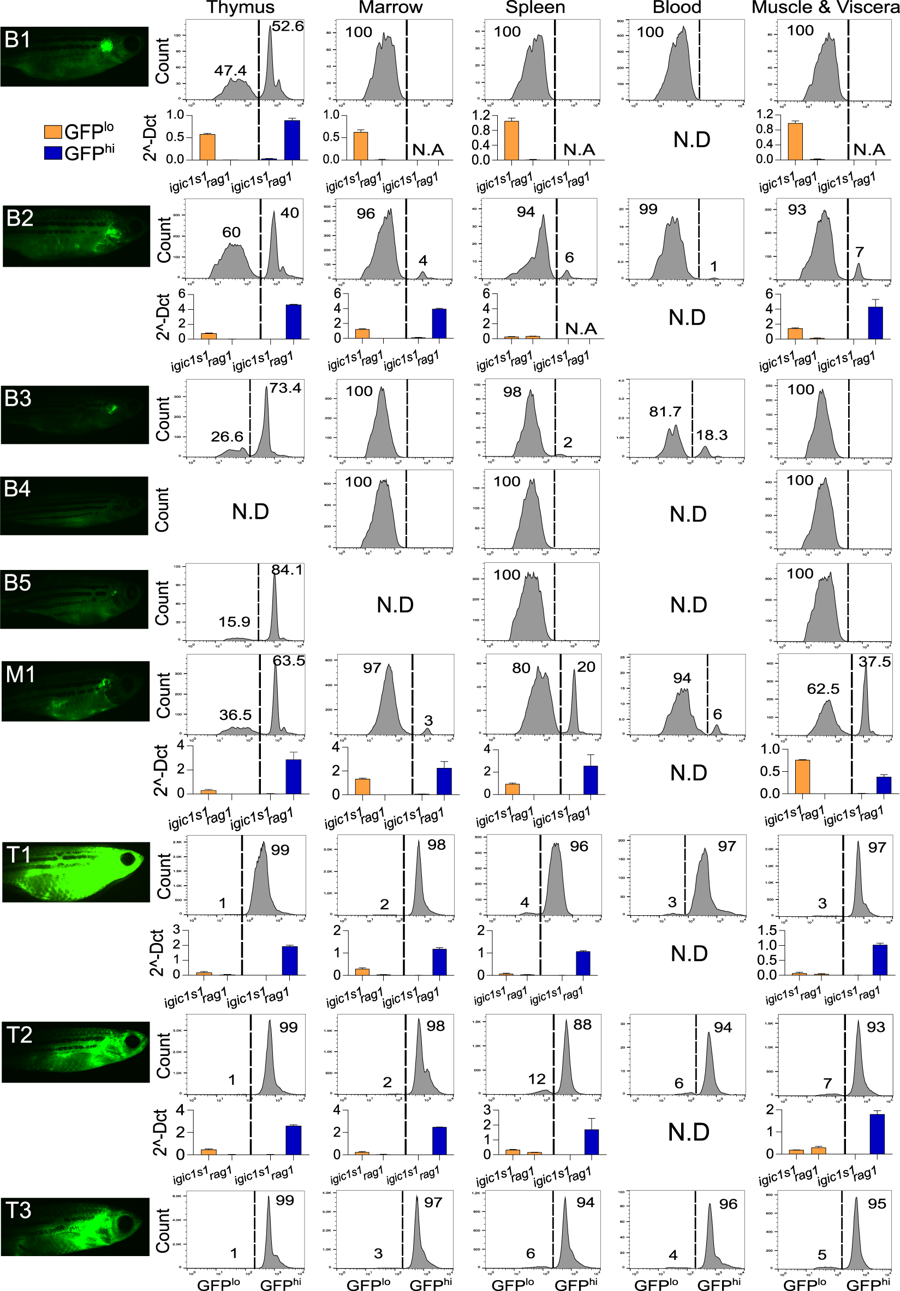
Fig. 5
GFP intensity and igic1s1/rag1 distinguish pre-B vs. T-ALL in each anatomic site. Left column shows high-exposure fluorescent microscopy of 4 month-fish with pre-B ALL (B1-5), mixed ALL (M1), or T-ALL (T1-3). Panels at right show flow cytometric analysis of GFPlo and GFPhi cells of thymus, marrow, spleen, peripheral blood, and muscle & abdominal viscera. Each panel shows % of GFPlo vs. GFPhi cells in the entire GFP+ gate; 105 events from the lymphoid/precursor gate were analyzed for each plot. N.D.= not determined. Histograms depict expression of igic1s1 and rag1 by qRT-PCR in five hMYC fish with pre-B ALL (B1, B2), mixed ALL (M1) or T-ALL (T1, T2). Results are normalized to housekeeping genes (β-actin and eef1a1l1) and shown as mean + Standard Error (S.E.). N.A.= not available due to insufficient cells for RNA extraction