
Image
|
Figure Caption
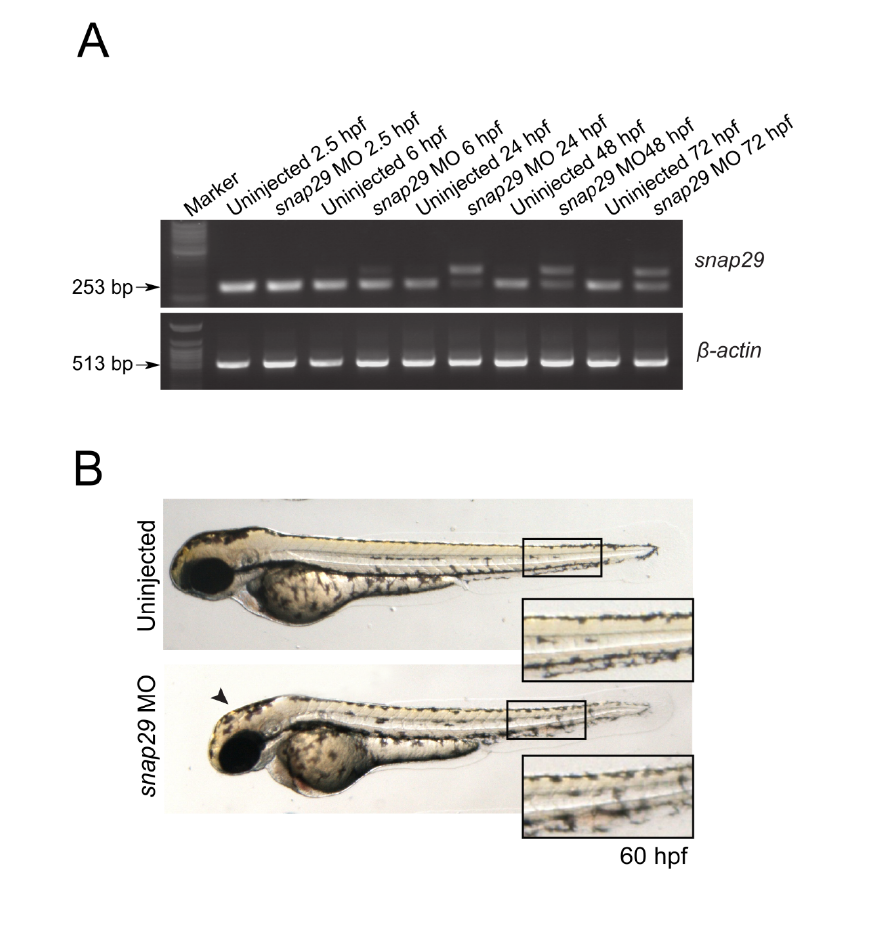
Fig. S1
(A) RT-PCR performed to assess snap29 transcript level using cDNA from embryos
uninjected or injected with a splicing block Morpholino against snap29 (SB MO snap29)
at the indicated hours post fertilization (hpf). β-actin was used as normalizer. (B) 60 hpf
uninjected embryos or embryos injected with SB snap29 MO. Morphants display lighter
pigmentation at the level of the head (arrowheads) and misaligned melanocytes in the tail
contour (high magnification in insets), compared to uninjected embryos.
Figure Data
Acknowledgments
This image is the copyrighted work of the attributed author or publisher, and
ZFIN has permission only to display this image to its users.
Additional permissions should be obtained from the applicable author or publisher of the image.
Full text @ Sci. Rep.