
|
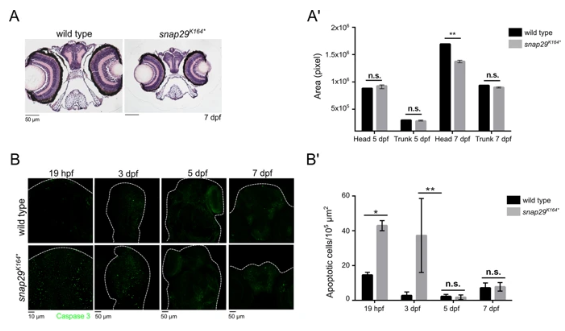
Fig. 3
snap29 mutant as a CEDNIK disease model. (A) Hematoxylin-eosin stained paraffin sections of heads of 7 dpf larvae. Note the reduced size of the head in snap29K164* mutant animals compared to wild type. (A’) Quantification of the area of head and of the trunk sections measured in wild type and snap29K164* mutant respectively at 5 dpf and 7 dpf. At 7 dpf, snap29K164* mutants show a significant reduction of head area compared to wild type. Bars in the graph show means and standard deviations. P-values were obtained by unpaired t-test. **P ≤ 0.01, n = 3. (B) Comparable maximum projections of wild type and snap29K164*mutant heads at 19 hpf, 3 dpf, 5 dpf and 7 dpf stained with anti-cleaved Caspase 3 to reveal presence of apoptotic cells. White dashed-lines were drawn to highlight head morphology. (B’) Quantification of the number of apoptotic cells per 105 μm2, measured in wild type and snap29K164* mutants respectively at 19 hpf, 3 dpf 5 dpf and 7 dpf. 19 hpf and 3 dpf snap29K164* mutants show a significant increase of apoptotic cells compared to wild type. The bars in the graph show means and standard deviations. P-values were obtained unpaired t-test with Welch’s correction. *P ≤ 0.05, **P ≤ 0.01, n = 2–9.