
|
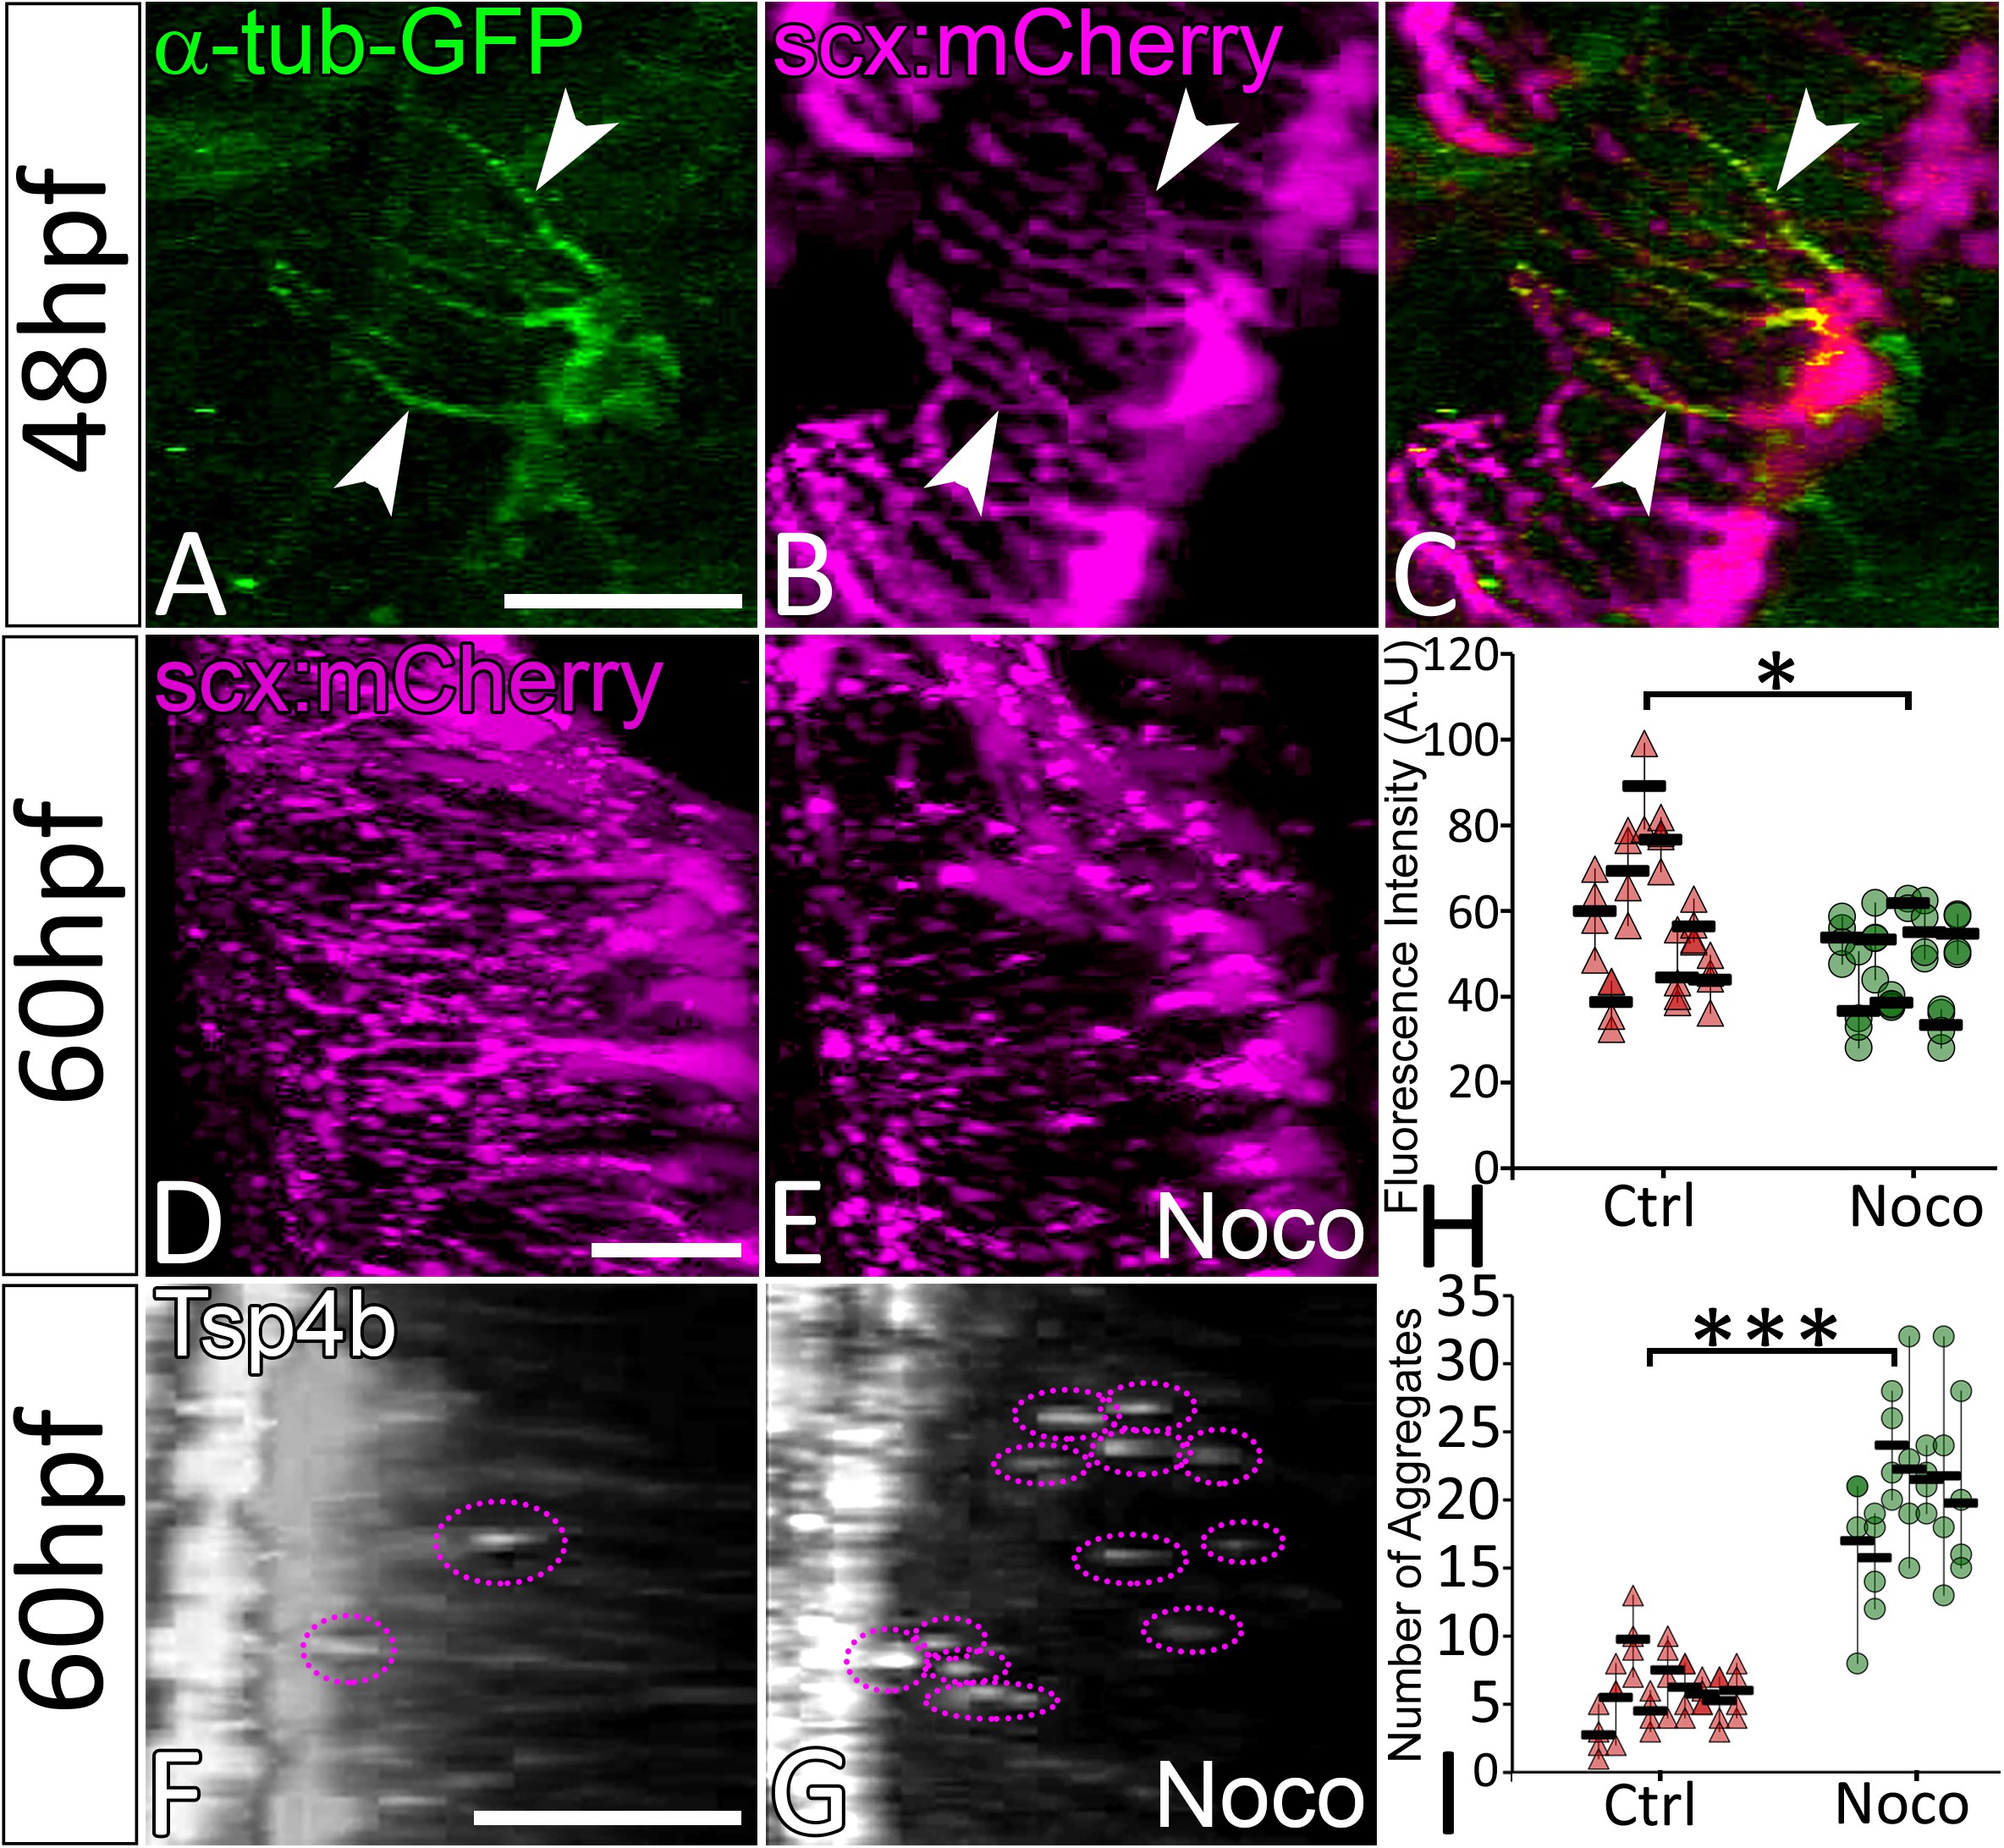
Fig. 4
Microtubule-rich tenocyte projections control tendon ECM localization.
Lateral views of live 48 hpf Tg(scx:mCherry) embryos injected with EGFP-alpha-Tubulin mRNA (A–C) showing localization of a-Tubulin along the length of projections colocalized with mCherry to mark in tenocytes. Transverse views of 3-D reconstructed live 60 hpf embryos showing tenocyte projections in DMSO-treated (D) and Nocodazole (Noco)-treated (E) embryos. Transverse view of 3-D reconstructed 60 hpf embryos immunostained for Tsp4b showing localization of Tsp4b in DMSO treated (F) and Noco treated (G) samples. Quantification of Tsp4b localization intensity in VMS (H) and distribution of Tsp4b aggregates in VMS (I) of DMSO-treated and Noco-treated embryos. (p value calculated by t-test for samples with unequal variance *<0.05, ***<0.0005). Scale bars = 20 microns. The measurements used for quantitative analysis and creation of the plots can be accessed from Figure 4—source data 1 and Figure 4—source data 2.