
|
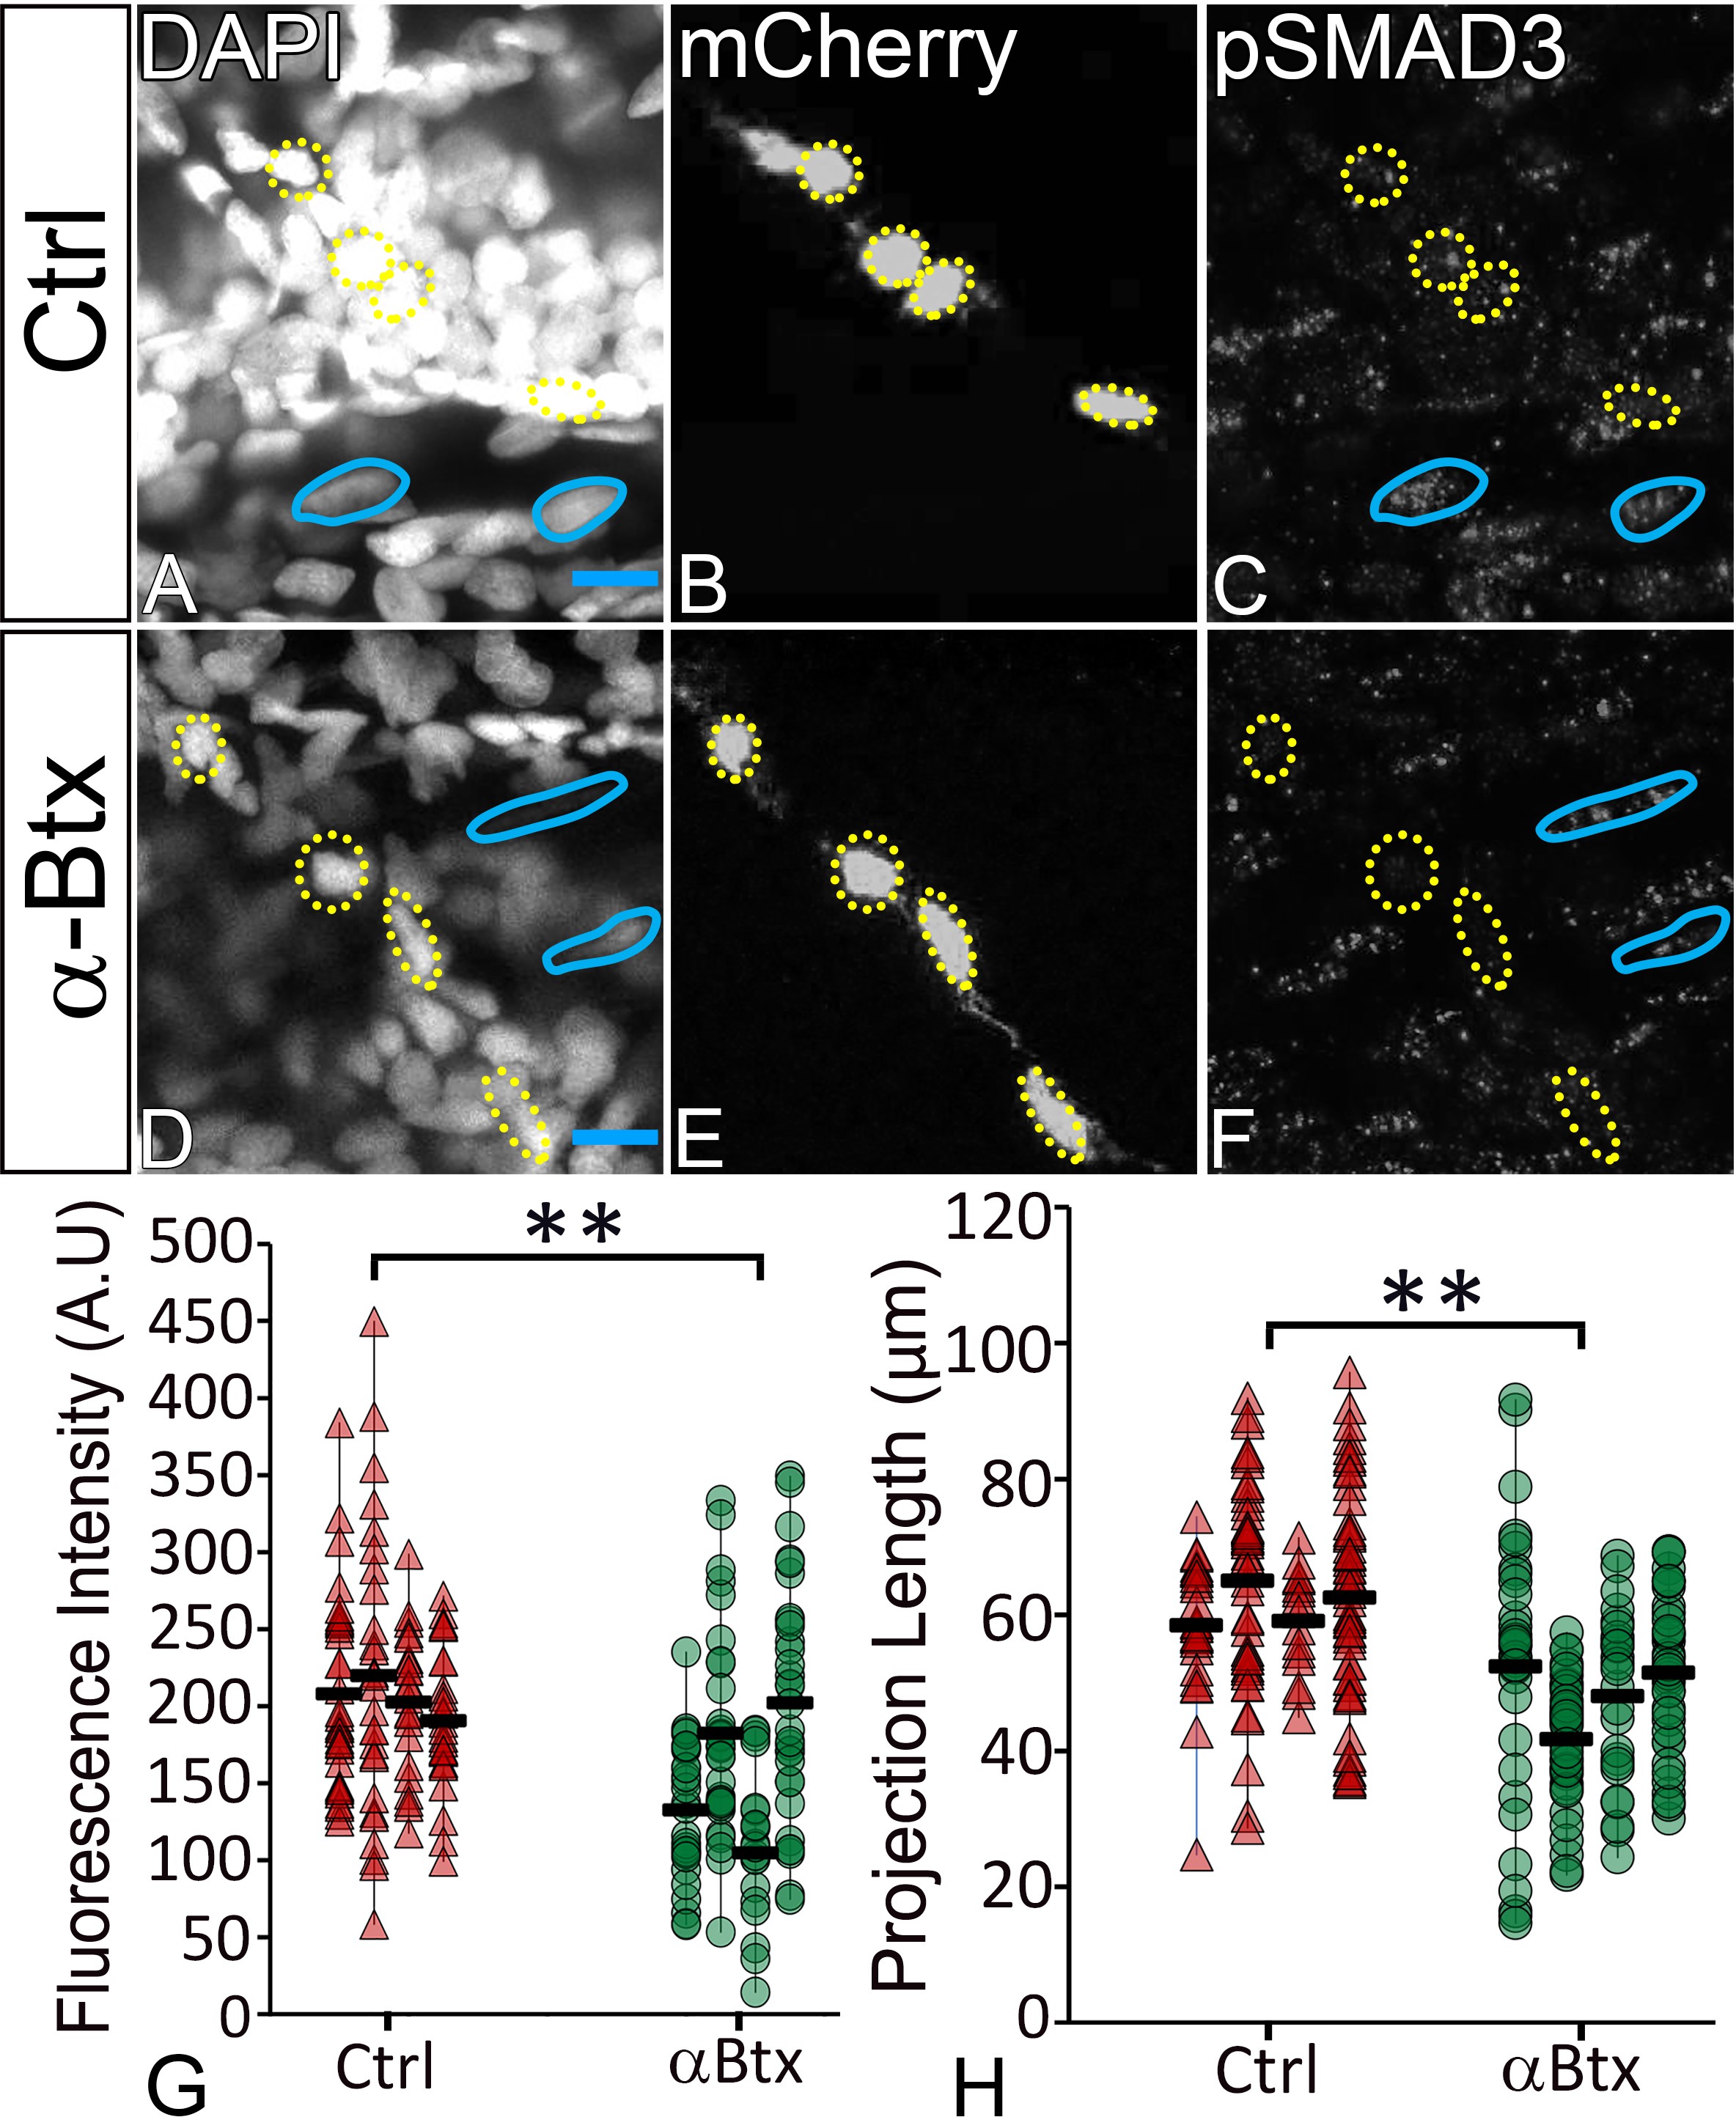
Fig. 6
TGFβ signaling in tenocytes requires mechanical force.
Lateral views of 48 hpf immunostained Tg(scx:mCherry) control (A–C) and αBtx injected (D–F) embryos showing nuclei (DAPI), tenocytes (anti-mCherry) and pSMAD3 (anti-pSMAD3) (marked by yellow-dotted ROI). (G) Localization of pSMAD3 was quantified as fluorescent intensity of nuclear pSMAD3 signal and plotted as a dot plot (n = 4, p value was calculated by t-test **<0.005). (H) Dot plot shows individual tenocyte projection lengths (p value was calculated by t-test **<0.00005). Representative muscle nuclei are marked by a blue continuous ROI. Scale bar = 10 microns. The measurements used for quantitative analysis and creation of the plots can be accessed from Figure 6—source data 1 and Figure 6—source data 2.