
|
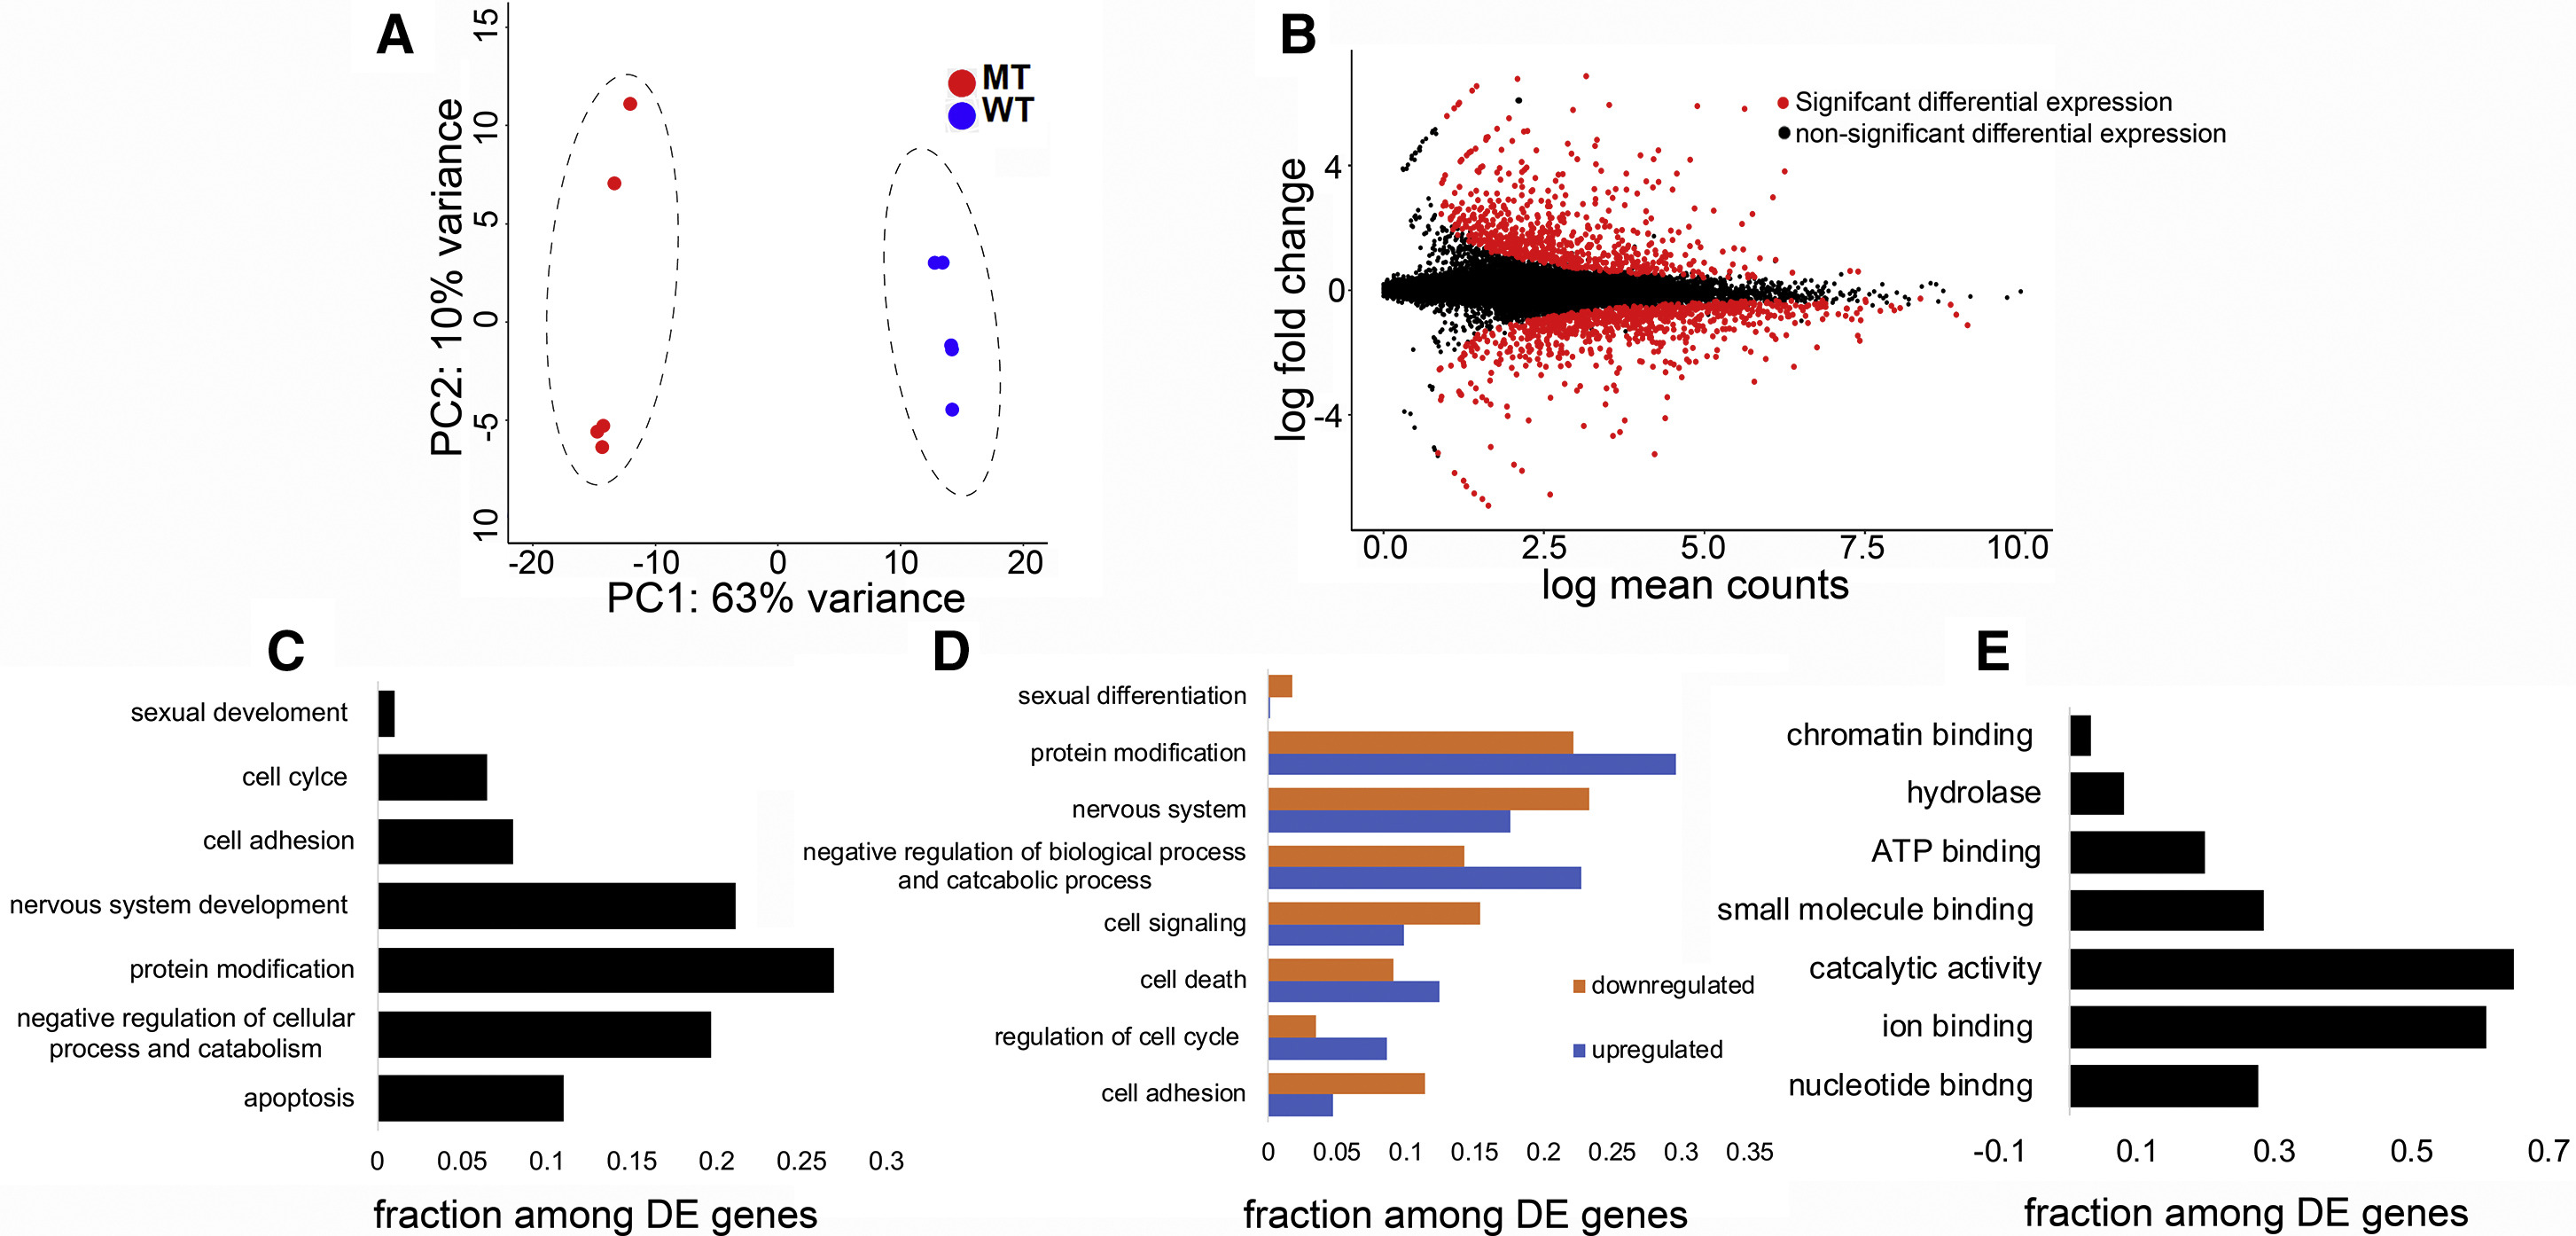
Fig. 5 The Transcriptome of hsf5−/− Zebrafish Gonad Is Substantially Different from that of Wild-Type
(A) Principal-component analysis (PCA) plot demonstrating the clustering of mutants further away from WT. (B) MA plot representing the differentially expressed genes (DEGs; in red). (C) Enrichment of biological processes among DEGs in hsf5−/− mutant testis, as shown by GO analysis. (D) Representation of enrichment of biological function separately for genes with upregulated and downregulated expression level. (E) Enrichment of genes under molecular function among DEGs in hsf5−/− mutant testis, as shown by GO analysis. n = 5 biological replicates in each group. See also Tables S4 and S5.