
|
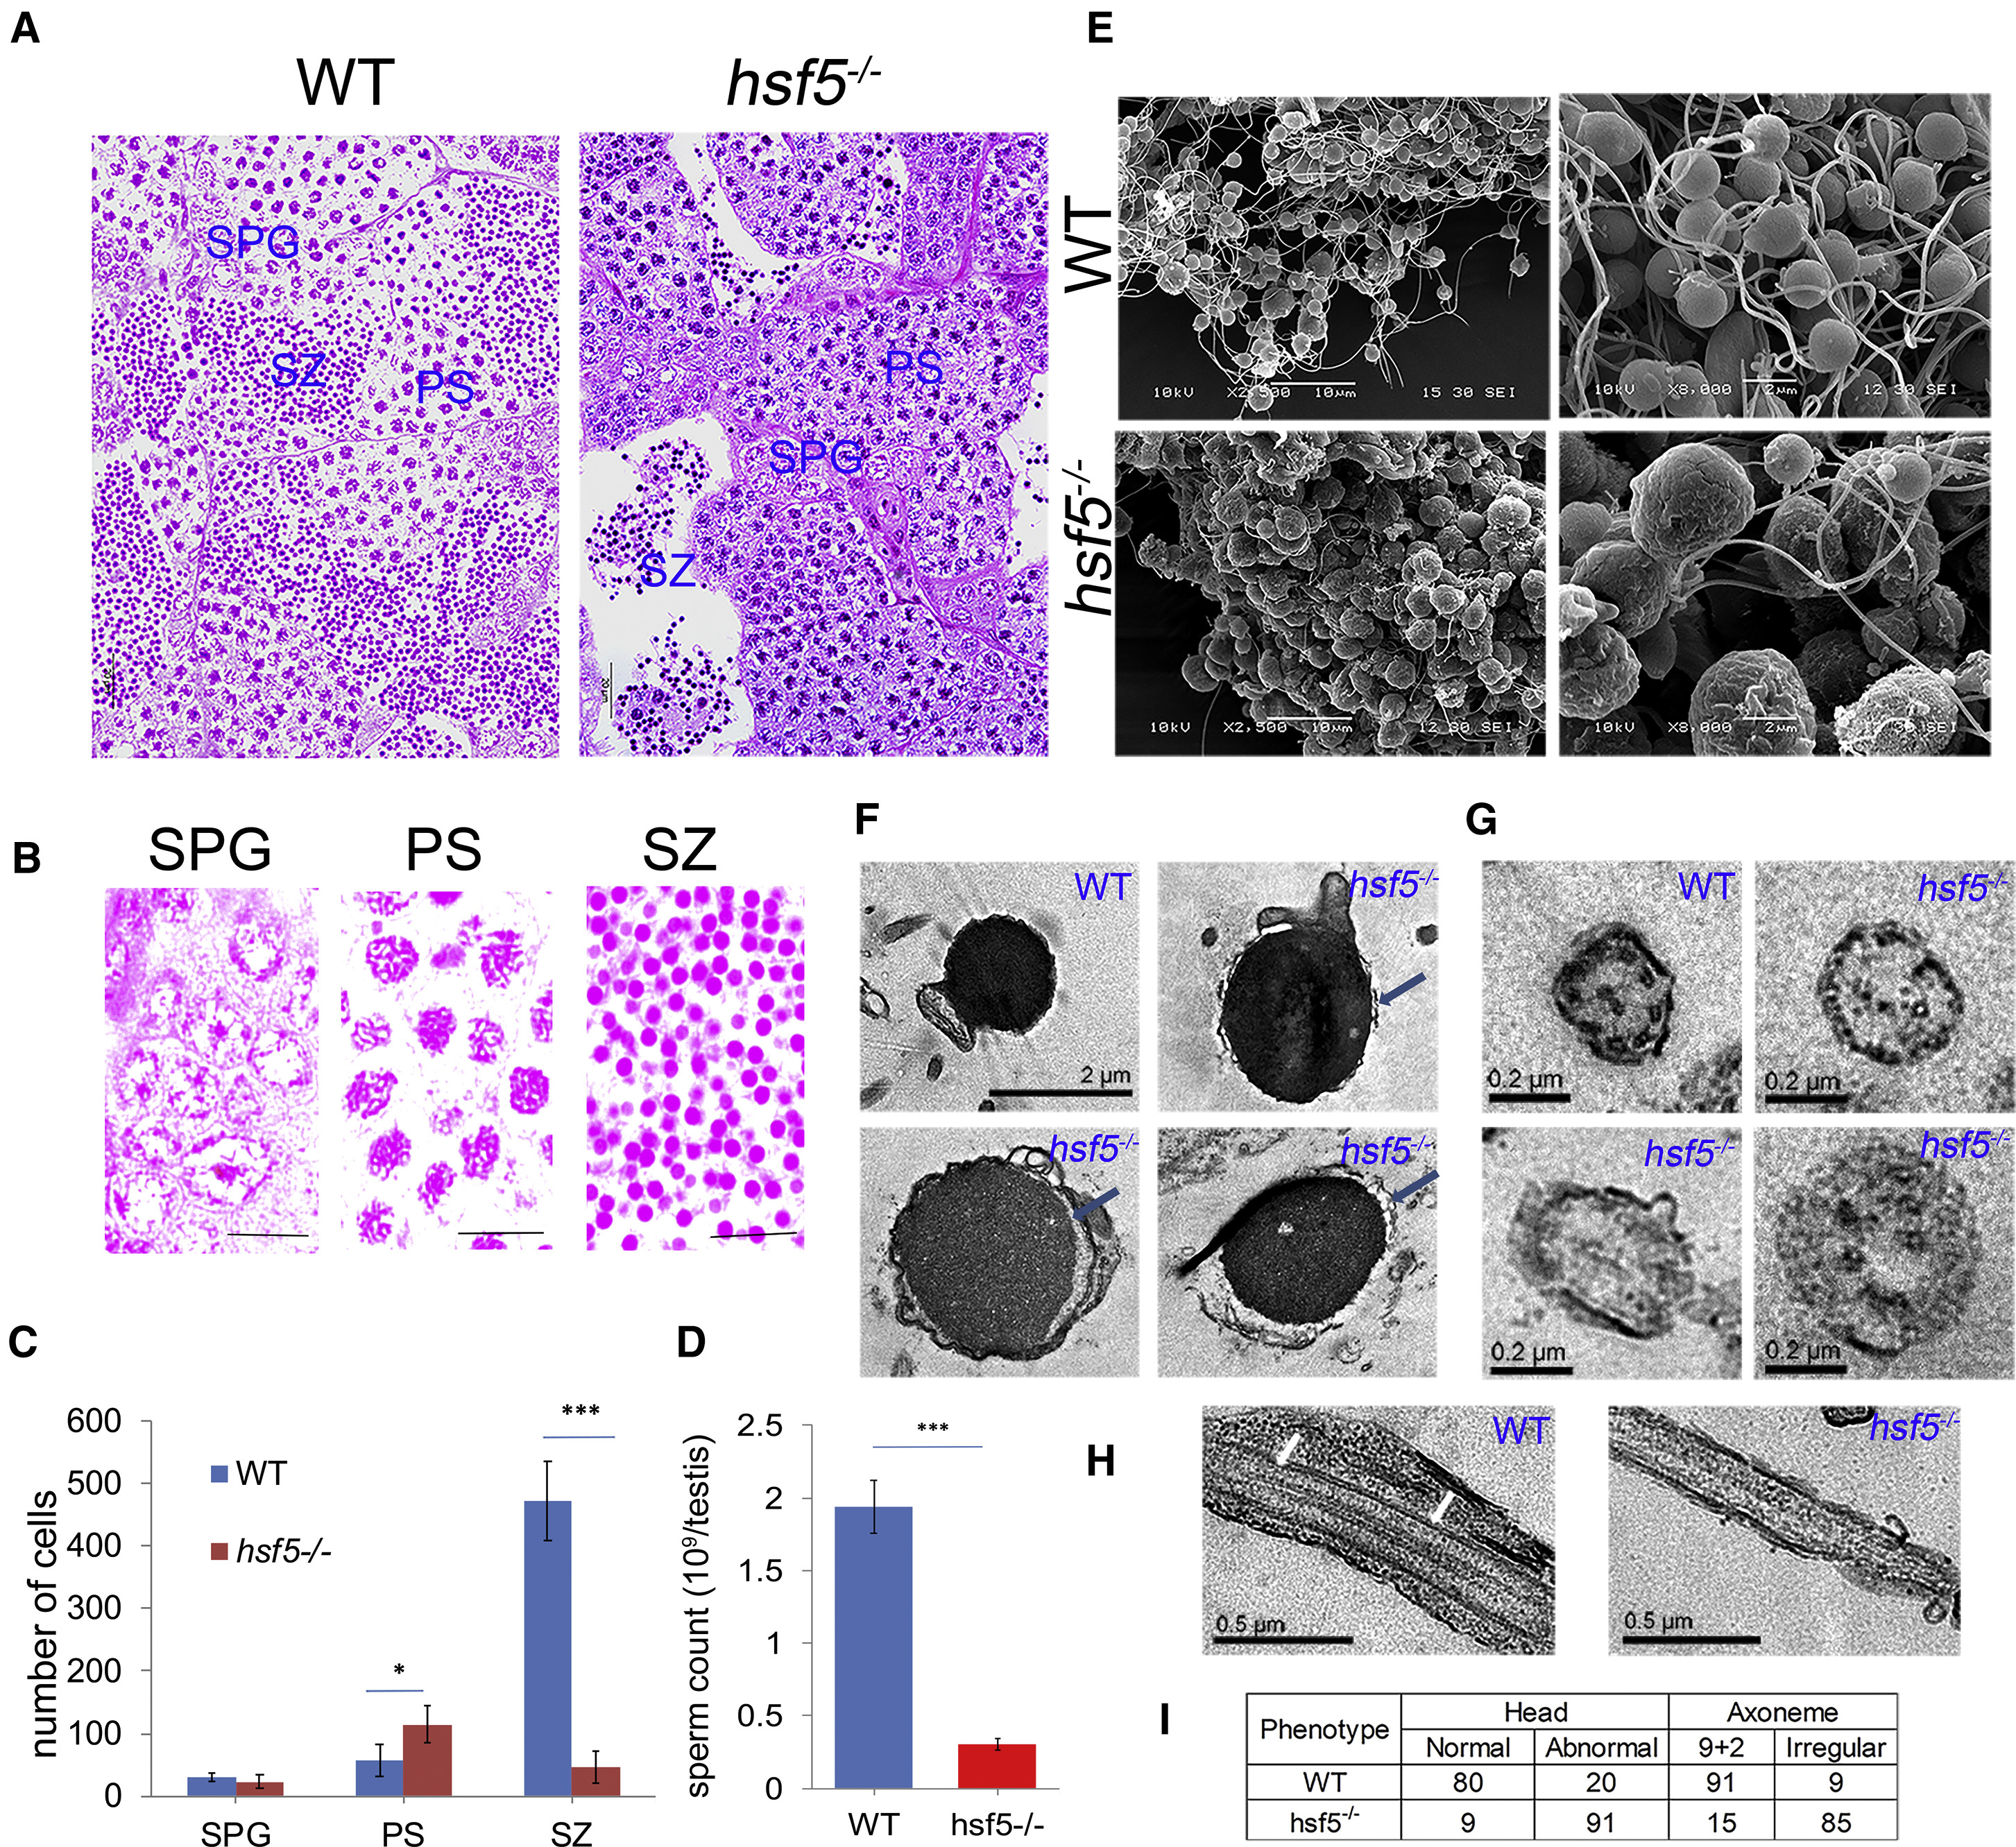
Fig. 3 Histological and Electron Microscopic High-Resolution Analysis of Testes and Spermatozoa Revealed Severe Reduction of Sperm Count and Defective Shape of Spermatozoa in hsf5−/− Mutant
(A) H&E staining of testicular sections showed severe loss of spermatozoa in hsf5−/− testis lumen, while abundant spermatozoa filled the lumen of WT. (B) Representative germ cell stages: spermatogonia (SPG), primary spermatocyte (PS) and spermatozoa (SZ). (C) Segmentation-based quantification of different cell types using histology images reflected accumulation of primary spermatocyte (PS) and drastic reduction of spermatozoa (SZ) in hsf5−/− testis in comparison to WT. (D) Haemocytometer-based sperm counting reflected severe reduction in the number of spermatozoa in hsf5−/− compared to WT. (E) Comparison of WT (top left and right) and hsf5−/− (bottom left and right) spermatozoa with scanning electron microscope showed clumping of spermatozoa (bottom left) with enlarged head and defective and shorter flagellum (bottom right) in the latter. (F) Comparison of WT and hsf5−/− sperm heads using transmission electron microscopy (TEM) showed the latter with dislocated cytoplasmic membrane (blue arrows) and intense vacuolization. (G) Representative magnified TEM images of cross section through the central region of a WT and hsf5−/− sperm flagella showed severe defects in the organization of axoneme in the latter. (H) Representative magnified TEM images of longitudinal section of WT and hsf5−/− sperm flagella showed severe defects in microtubules of the mutant. Microtubules in WT sperm flagella are marked by white arrows. (I) Quantitation of defects in the head and microtubule arrangements in axonemes of WT and hsf5−/− spermatozoa. For (C) and (D), error bars indicate ± SD; n = 8 biological replicates for (C) and 4 for (D); difference between groups was statistically examined with unpaired two-tailed Student’s t-test; ∗p < 0.05; ∗∗∗p < 0.001. For (E)–(I), n = 4 biological replicates in each group. Scale bars: 20 μm in (A); 10 μm in (B) and (E, left); 2 μm in (E, right) and (F); 0.2 μm in (G); and 0.5 μm in (H).