
Image
|
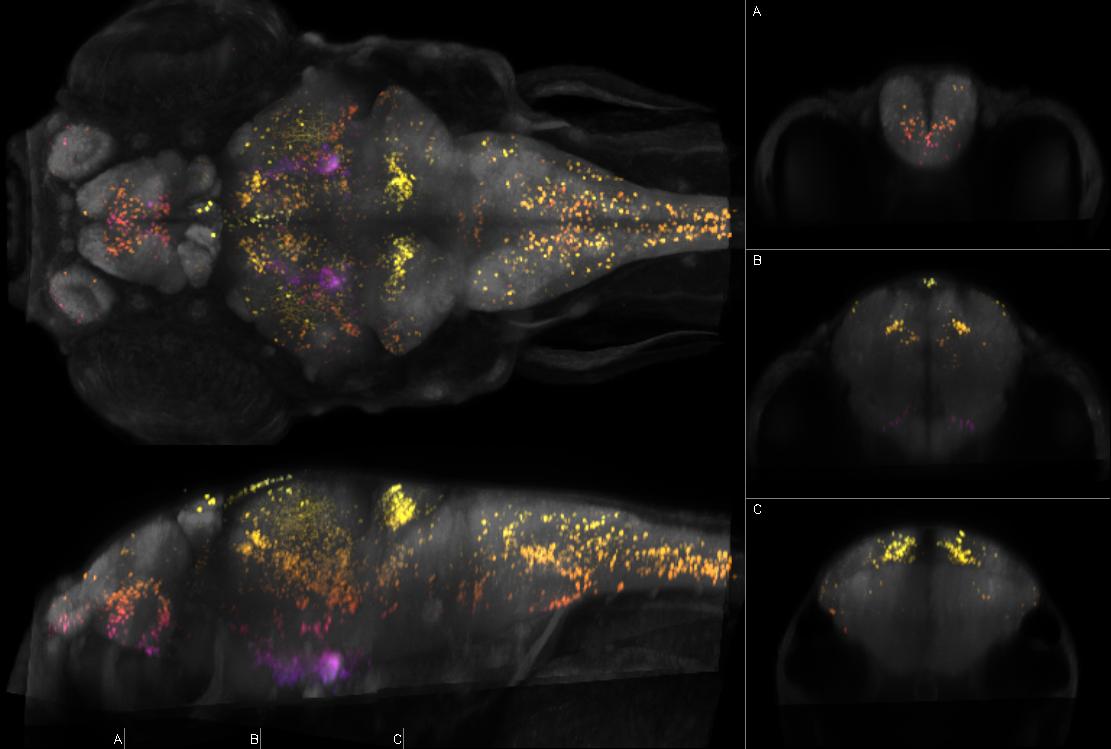
Figure Caption
Fig.93 Left: dorsal and sagittal maximal confocal projections from Zebrafish Brain Browser. Right: coronal slices at the indicated levels. Depth coded by color. Intensity represents mean expression in larvae transgenic for y275Et and Tg(UAS:Kaede)s1999t which expresses Kaede in olfactory sensory neurons, subpallium, preoptic region, pretectum, optic tectum, tegmentum, cerebellar plate, cerebellum (eminentia granularis), torus longitudinalis, torus semicircularis, hypothalamus, medulla (caudal), retina, motor neurons, punctate cells on yolk
Figure Data