
Image
|
Figure Caption
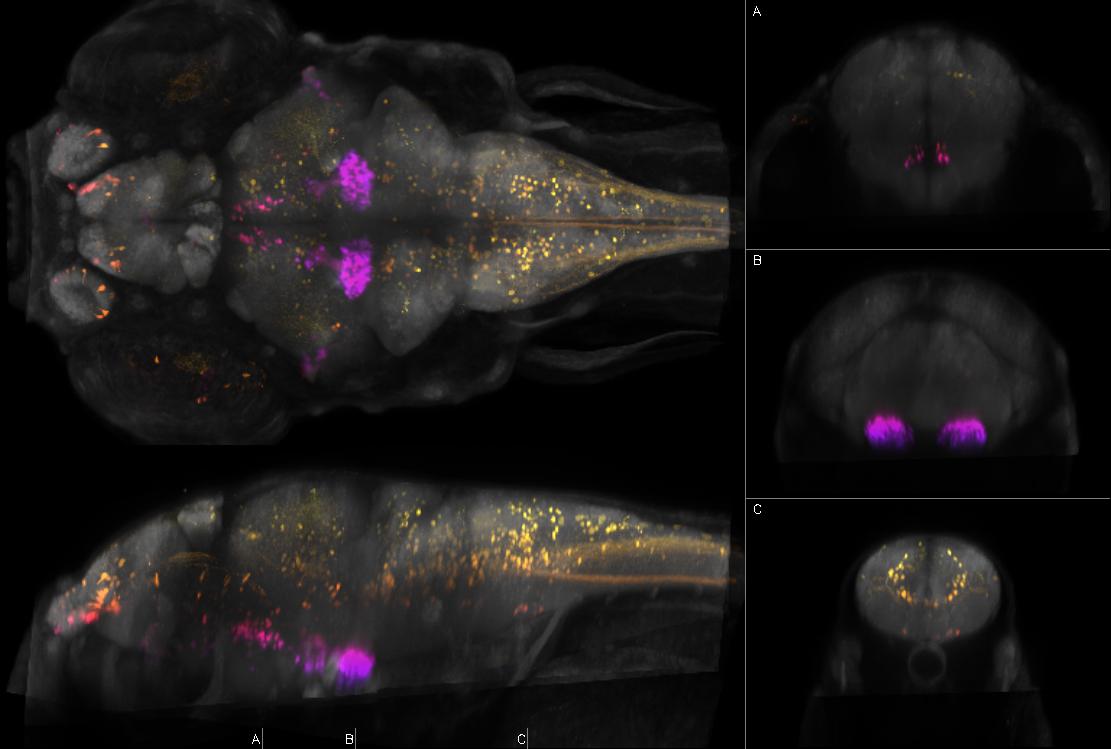
Fig.113 Left: dorsal and sagittal maximal confocal projections from Zebrafish Brain Browser. Right: coronal slices at the indicated levels. Depth coded by color. Intensity represents mean expression in larvae transgenic for y341Et and Tg(UAS:Kaede)s1999t which expresses Kaede in hypothalamus - caudal zone (selective), retina, spinal cord
Figure Data