
IMAGE
Fig.107
- ID
- ZDB-IMAGE-190501-114
- Genes
- Publication
- Tabor et al., 2018 - Brain-wide cellular resolution imaging of Cre transgenic zebrafish lines for functional circuit-mapping
Image
|
Figure Caption
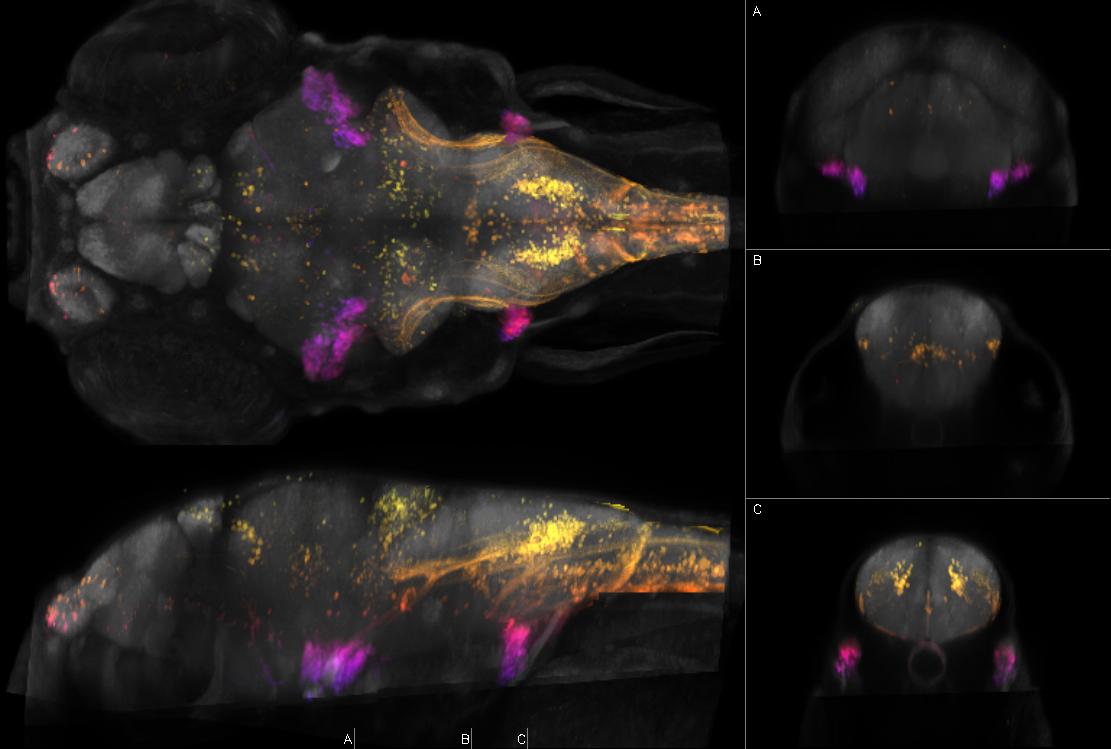
Fig.107 Left: dorsal and sagittal maximal confocal projections from Zebrafish Brain Browser. Right: coronal slices at the indicated levels. Depth coded by color. Intensity represents mean expression in larvae transgenic for y423Et and Tg(UAS:Kaede)s1999t which expresses Kaede in optic tectum (neuropil), medulla oblongata (several clusters), vagus motor neurons, trigeminal ganglion, aLLg, pLLg, vagal ganglion, retina, spinal cord, endocrine pancreas, notochord
Figure Data