
Image
|
Figure Caption
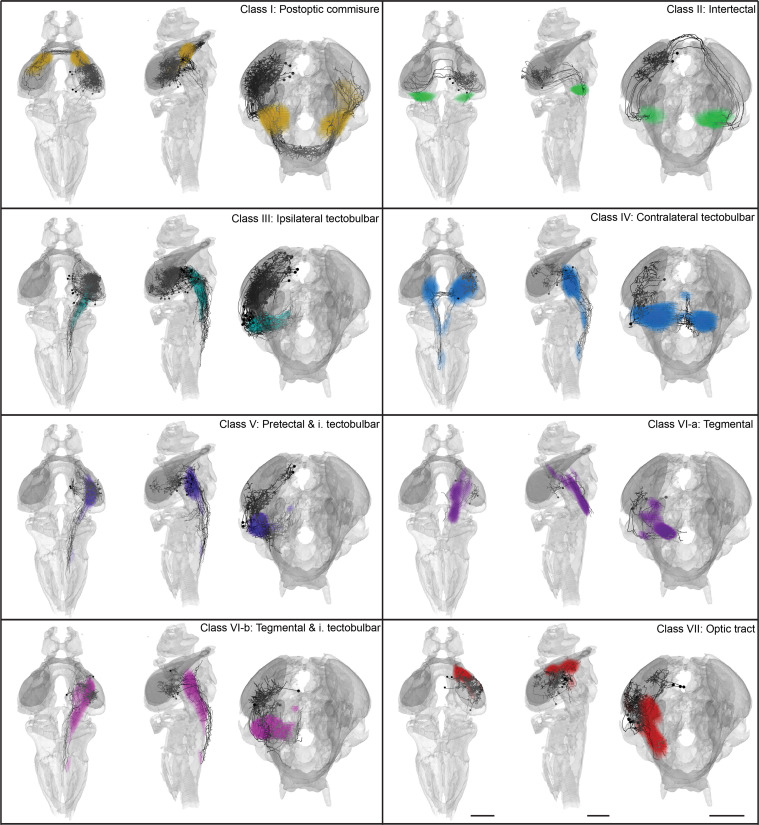
Fig. 4 Different Projection Classes Shown is a detailed representation of arborization densities for all eight projection classes (color-coded) together with the single-cell tracings of the corresponding neurons (black traces). For each class, different views in the anteroposterior, dorsoventral, and mediolateral axis are shown. Scale bars represent 100 μm. See also Figures S4 and S5.
Acknowledgments
This image is the copyrighted work of the attributed author or publisher, and
ZFIN has permission only to display this image to its users.
Additional permissions should be obtained from the applicable author or publisher of the image.
Full text @ Neuron