
|
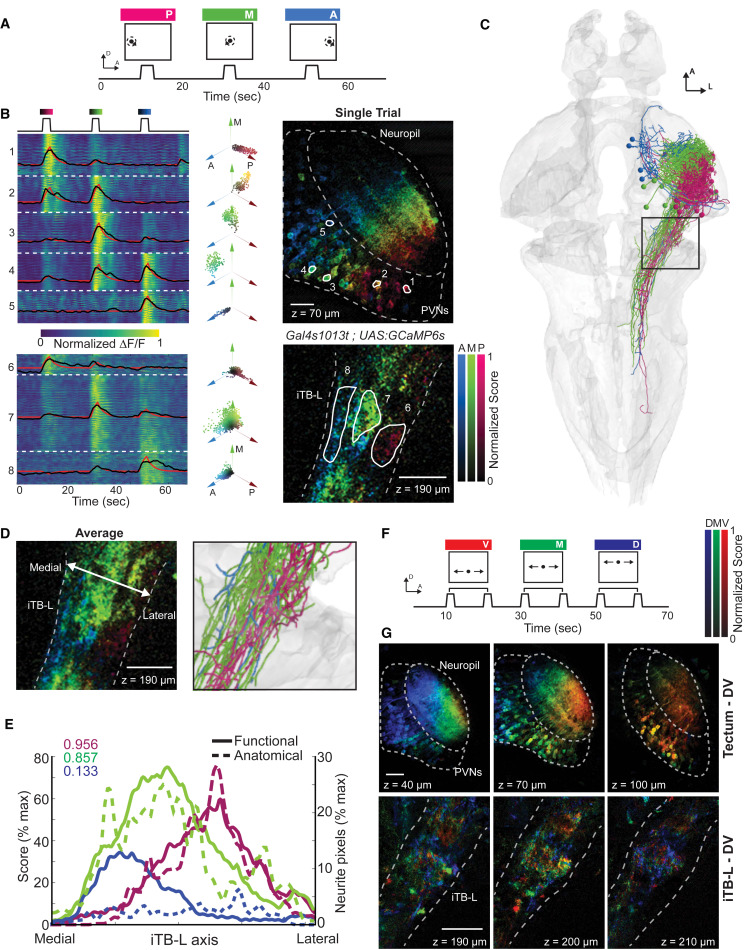
Fig. 6 Retinotopic Target Information Is Maintained along the AP Axis in iTB-L Axons (A) Visual stimulus protocol of a black dot (8°) circling around a center point for 3 s in three different positions of the visual field (posterior, medial, and anterior). (B) Single trial representation of responses to the three stimulus positions. Left: a raster plot of the ΔF/F traces for every pixel together with an average (black) and fitted (red) response for each ROI (right). Right: the scores from a linear regression to the three stimuli color-coded in an HSV image that was hue-shifted to increase the contrast. Dashed lines represent the tectal neuropil, periventricular neurons, and the lateral portion of the iTB, whereas solid lines show the outline of manually drawn ROIs. Center: a polar plot of pixel responses in each ROI as a two-dimensional projection. The hue (angle) represents the tuning to the stimulus position, whereas the saturation (radius) shows the normalized score of each pixel. (C) Anatomical substrate of the conserved retinotopic output. Neurons in the reference brain of projection class III, targeting solely the iTB-L, are color-coded with respect to their cell body position along the anterior-posterior axis of the tectum. (D) Comparing the average functional responses of the iTB-L (three trials) with the anatomical wiring (enlargement of black box in C) illustrates a similar representation of information flow. (E) Overlap of functional (solid lines, n = 3 fish) and anatomical (dashed lines) distributions in the iTB-L. Pearson correlation coefficients of the functional and corresponding anatomical distributions are shown in the top left corner. (F) Modified stimulus protocol to investigate the dorsal-ventral representation, including stimulus movements along three elevations spanning, in total, 30° (ventral, medial, and dorsal). (G) Average responses for three trials in three different planes imaged in the tectum and the iTB. Although the elevation of the object is encoded along the dorsal-ventral axis in the tectum, the signals in the iTB are distributed. The scale bars represent 20 μm. See also Figure S7.