
|
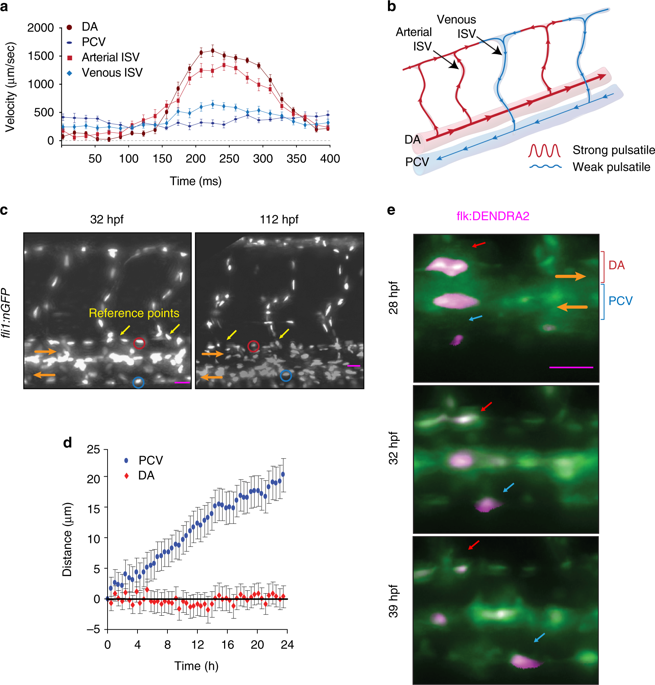
Fig. 4 Blood flow promotes EC migration in veins but not in arteries. Panels (c), and (e) show lateral images of zebrafish embryos with anterior side facing left. Orange arrows indicate the direction of blood flow. a Velocity of erythrocytes as a function of time within one heart beat (n = 16 vessels per condition; average of large number of heart beats per vessel). b Schematic representation of the dynamics of blood flow in the intersegmental vasculature. c All ECs express nuclear-localized GFP. Intersegmental vessels (yellow arrows) serve as reference points for determining the location of tracked arterial (red ovals) and venous (blue ovals) ECs. Scale bar is 30 μm. d Average displacements of ECs in the PCV (blue, n = 42, 6 embryos) and DA (red, n = 25, 6 embryos) as functions of time. Displacement of ECs was analyzed with at least 6 venous and 4 arterial ECs per embryo. Displacement is considered positive, if the cell migrates upstream. e All ECs express photo-convertible (green-to-red) fluorescent protein DENDRA2. The photo-conversion was done at 28 hpf in the DA and PCV. Red arrows point to an arterial EC and blue arrows point to a venous EC. Scale bar is 25 μm