
Image
|
Figure Caption
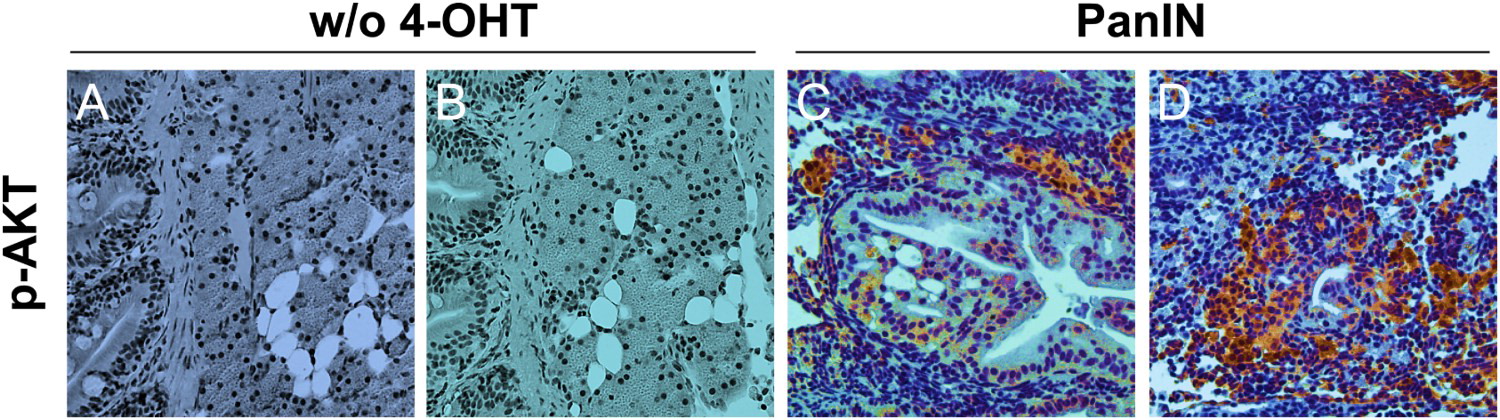
Fig. 4
Characterization of the KRAS downstream signaling pathway in PanIN regions. (A and B) Phospho-AKT staining in groups without 4-OHT treatment (w/o 4-OHT) as controls. Scale bars: 50 μm. (C and D) Phospho-AKT staining in PanIN regions. Scale bars: 50 μm.
Figure Data
Acknowledgments
This image is the copyrighted work of the attributed author or publisher, and
ZFIN has permission only to display this image to its users.
Additional permissions should be obtained from the applicable author or publisher of the image.
Full text @ Animal Cells Syst (Seoul)