
Image
|
Figure Caption
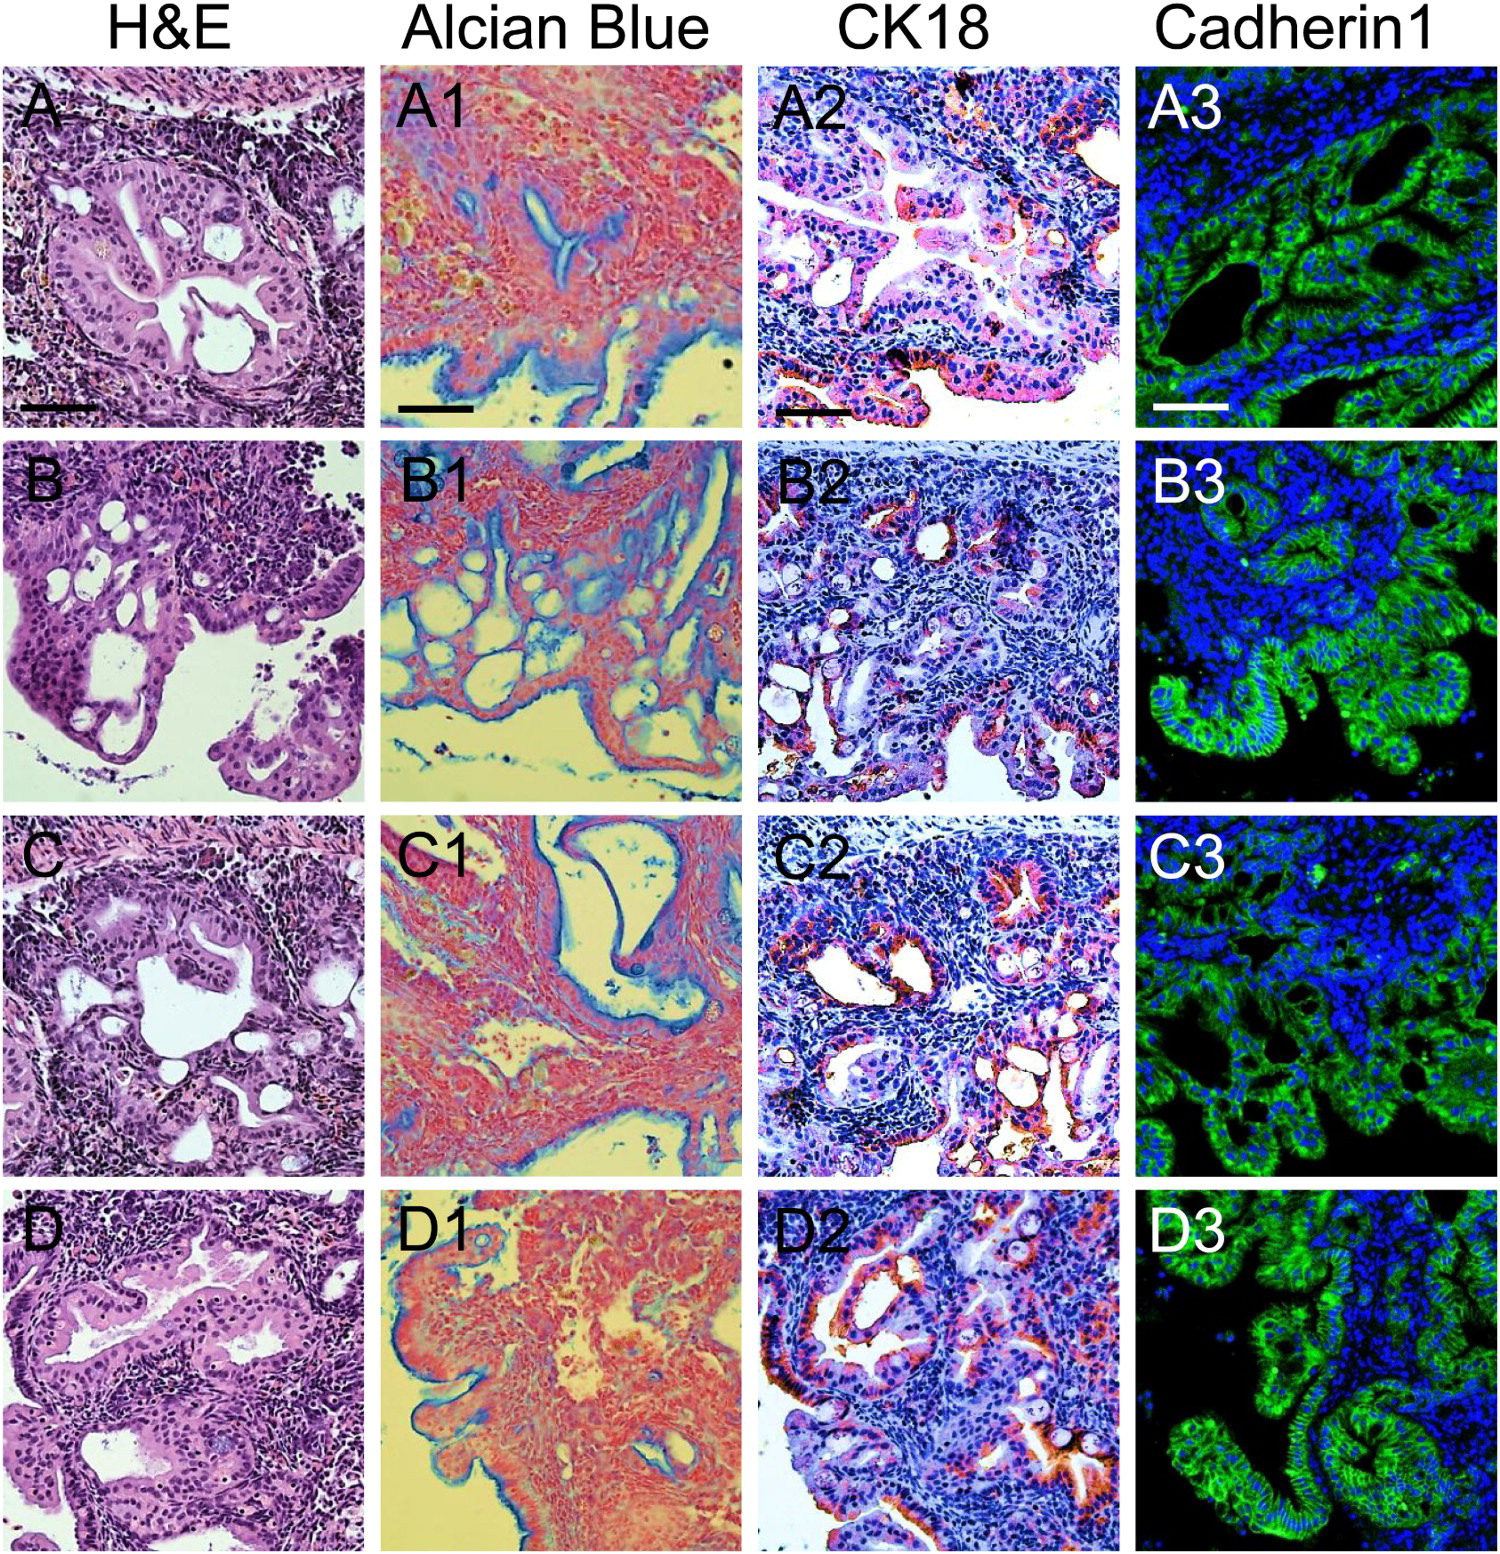
Fig. 2
Histological and immunohistochemical profiles in PanIN regions. (A–D) Several grades of differentiation ranging from PanIN-1 to PanIN-3 in PanIN regions, as indicated by hematoxylin and eosin (H&E) staining. (A1–D1) Alcian blue staining. (A2–D2) CK-18 staining. (A3–D3) Cadherin1 staining
Figure Data
Acknowledgments
This image is the copyrighted work of the attributed author or publisher, and
ZFIN has permission only to display this image to its users.
Additional permissions should be obtained from the applicable author or publisher of the image.
Full text @ Animal Cells Syst (Seoul)