
|
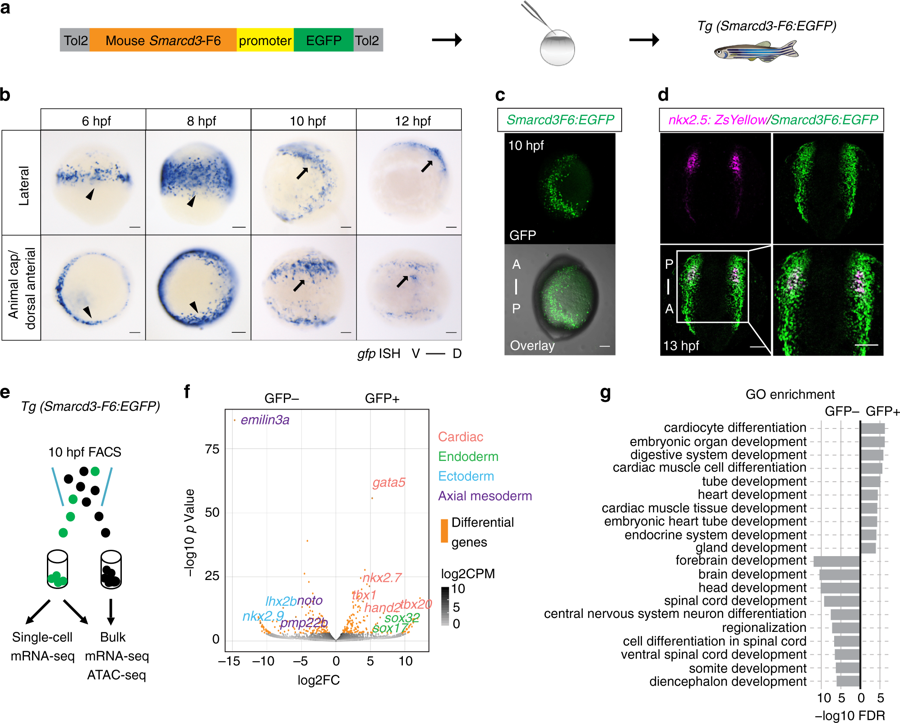
Fig. 1 Mouse Smarcd3-F6 enhancer labels early cardiac progenitors in zebrafish. a Generation of Tg(Smarcd3-F6:EGFP) zebrafish line b In-situ hybridization against gfp transcripts on Tg(Smarcd3-F6:EGFP) transgenic embryos. Smarcd3-F6 enhancer marks lateral margins (arrowheads) during gastrulation and ALPM regions (arrows) after gastrulation. c Native GFP expression in Tg(Smarcd3-F6:EGFP) embryos at 10 hpf. Embryos are shown in lateral views. d Immunostaining of GFP and ZsYellow on Tg(Smarcd3-F6:EGFP) and Tg(nkx2.5:ZsYellow) double transgenic embryos. Cells expressing ZsYellow were marked by GFP as well. e Workflow of mRNA-seq and ATAC-seq experiments. f Volcano plot showing genes differentially expressed between Smarcd3-F6:GFP+ and Smarcd3-F6:GFP- populations (FDR < 0.05, absolute log2FC > 1). g Top 10 most enriched GO terms obtained from genes that were significantly more highly expressed in Smarcd3-F6:GFP+ or Smarcd3-F6:GFP- populations. All scale bars represent 100 μm