
Image
|
Figure Caption
Fig. S1
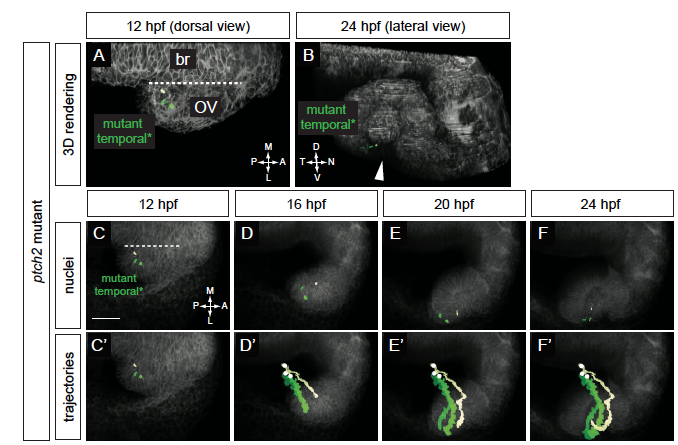
Origin and movement of cells contributing to the temporal optic fissure margin in the ptch2tc294z mutant.
(A-F’) ptch2tc294z mutant temporal optic fissure cell movements (12-24 hpf). (A) Rendering of nuclei and membrane channel, 12 hpf, dorsal view. (B) Rendering of nuclei and membrane channel, 24 hpf, lateral view. (C-F) Nuclei over membrane channel average projection. (C’-F’) Trajectories over membrane channel average projection. Cells execute a novel trajectory. Scale bar, 50 μm.
Figure Data
Acknowledgments
This image is the copyrighted work of the attributed author or publisher, and
ZFIN has permission only to display this image to its users.
Additional permissions should be obtained from the applicable author or publisher of the image.
Full text @ Development