
|
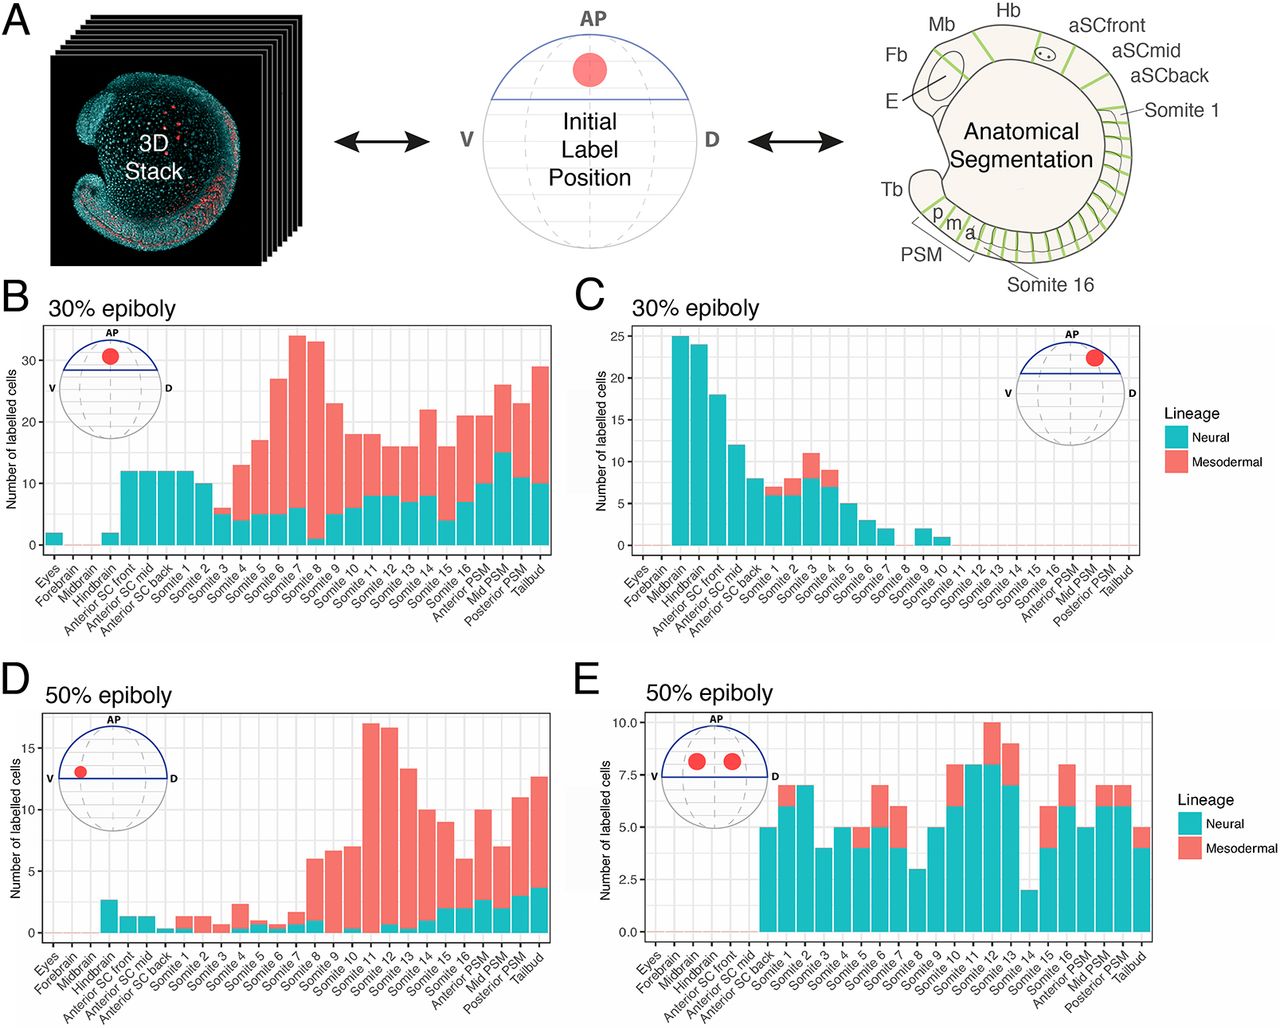
Fig. 3
Axial dispersion and neuro-mesodermal contribution of labelled cells. (A) 3D confocal stacks of photolabelled embryos were analysed to relate the initial label position with the contribution of cells along the anterior-posterior axis. (B-E) The contributions of labelled populations from individual examples are plotted against the anterior-posterior axis with the number of cells in each tissue compartment shown in red for the somitic mesoderm or blue for the neural tube. There is a significant degree of overlap between spinal cord- and mesoderm-fated cells within the marginal zone at both 30% (B,C) and 50% (D,E) epiboly.