
|
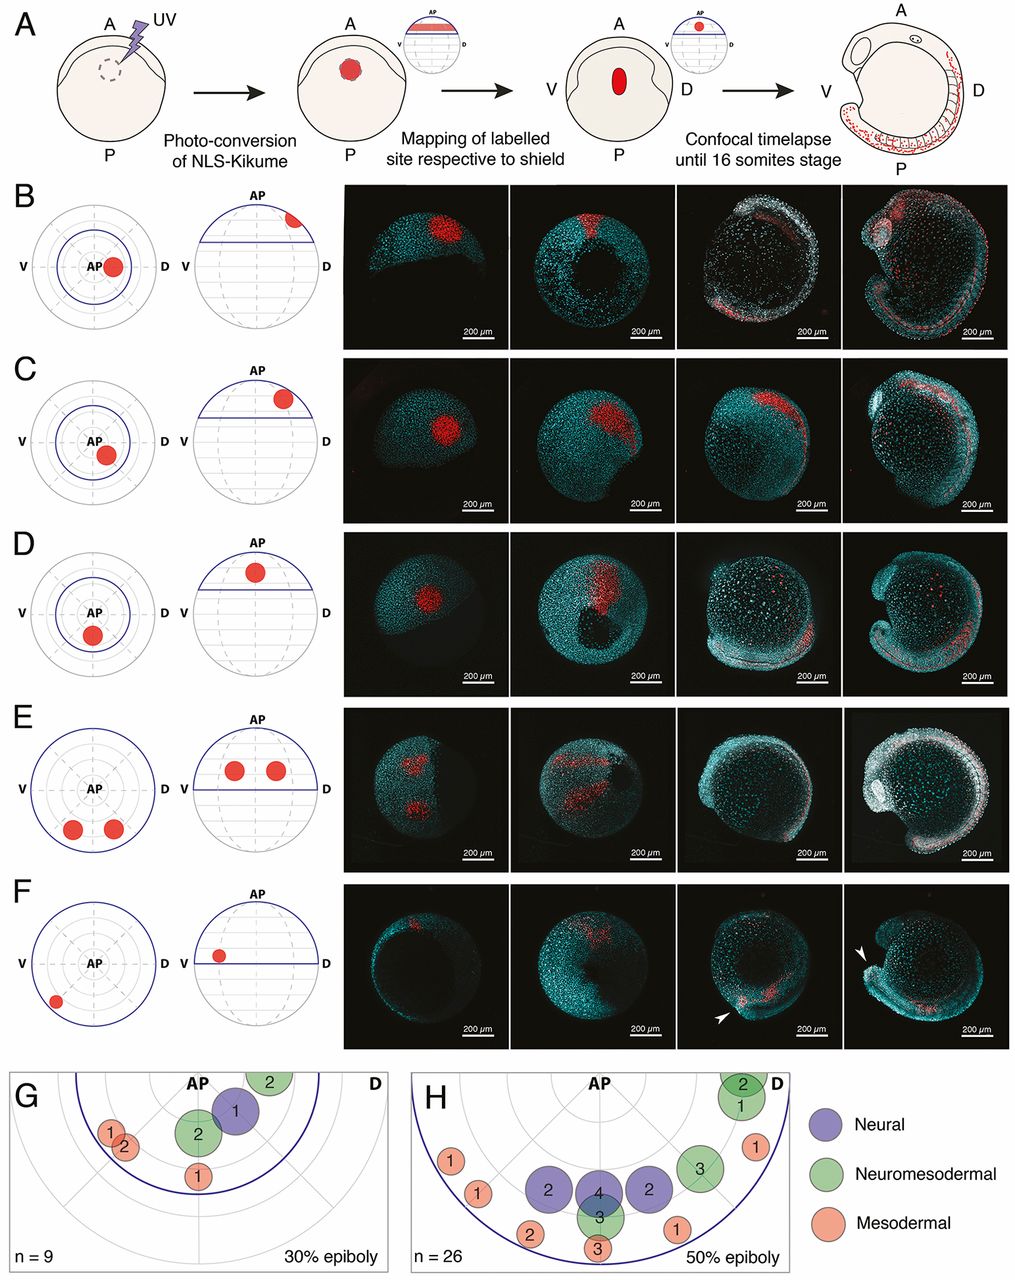
Fig. 2
Tissue-level segregation of spinal cord and mesoderm populations occurs by 50% epiboly. (A) Description of large-scale fate-mapping experiments. NLS-Kik-injected embryos are mounted for confocal microscopy at 30 or 50% epiboly, and a circular region of the blastoderm is photoconverted. Time-lapse imaging is carried out until the 16-somite stage. Position of the label is retrospectively assigned based on its location on the anterior-posterior axis (determined at the moment of labelling) and the position of the prospective embryonic shield (appearing right after 50% epiboly), which marks the dorsal side of the embryo. (B-F) Embryos were photolabelled in the territories shown in the animal and lateral view diagrams (left-most image) and cells were followed until the 16-somite stage (right-most image panels) by time-lapse microscopy. Consecutive time points are displayed in the right-hand four panels for each example label. Labels were placed in the prospective anterior neural (B), marginal zone (C) and prospective spinal cord (D) territories at 30% epiboly. At 50% epiboly, the boundaries of the prospective spinal cord region (E) and a smaller, more ventro-marginal, mesodermal region (F) were mapped. Arrowheads in F indicate that a subset of labelled cells specifically migrates and contributes to the tailbud mesenchyme. Native NLS-KikGR is shown in cyan, photoconverted NLS-Kik in red. (G,H) Plots showing the location and diameter of labels in relation to the number of embryos imaged per label at 30% (G) and 50% (H) epiboly. Labels are colour-coded according to the ratio of cells allocated to neural tissues or paraxial mesoderm. Blue indicates that over 90% of labelled cells contribute to neural tissues; red indicates that over 90% of labelled cells contribute to paraxial mesoderm; green indicates that labelled cells contribute both to neural and paraxial mesoderm. n indicates total number of embryos fate mapped. AP, animal pole; V, prospective ventral side; D, prospective dorsal side (shield). Dorsal and ventral only indicate 3D orientation of the embryo and not future dorsoventral position of cells.